19 Simple Linear Regression
So far, we have only considered individual estimation and inference (for single parameters) or else the comparison between single parameters. While these estimation and comparison procedures are widely applicable and a powerful basis for inquiry, they fail to capture an important type of statistical analysis. Specifically, the forms of estimation and hypothesis testing considered thus far have not provided a means of capturing the relationship between two (or more) variables. Regression models generally provide one method for accomplishing this task.
19.1 Linear Relationships and Lines of Best Fit
The most basic mathematical function that we can conceive of is a straight line. We can consider the equation of a line, \[y = mx + b,\] where \(y\) is the dependent variable and \(x\) is the independent variable. In this equation, \(m\) represents the slope of the line,1 a quantity that indicates how much the value of \(y\) changes as the value of \(x\) changes. The term \(b\) represents the intercept of the line,2 which corresponds to the value of \(y\) when \(x=0\). This relationship is deterministic in that, if \(y = mx + b\) actually holds, then we can perfectly know the value of \(y\) for any value of \(x\), simply by specifying the values \(m\) and \(b\).
Despite the simplicity of the linear relationship, it remains a very powerful model for investigating the relationship between two variables. There are many quantities that follow a deterministic linear relationship, and we can exploit this simple pattern to understand their joint behaviour. For instance, if we have a vehicle that is traveling at a constant speed, then the distance traveled, \(d\), is given by the linear relationship \(d = mt\), where \(m\) is the speed and \(t\) is the time of travel. If you have an investment that will pay simple interest, then the total payout \(P\), is given by the linear relationship \(P = mx + x\), where \(m\) is the rate of return, and \(x\) is the initial investment. As a final example, the temperature measured in Fahrenheit, \(F\), is given by \(F = 1.8C + 32\), where \(C\) is the temperature measured in Celsius.
In each of these cases the dependent variable, also called the response variable, can be exactly explained by constants as well as the independent variable, also known as the predictor or explanatory variable. While there are many other situations that can be exactly described using linear relationships, there are even more settings in which an approximate linear relationship between the predictor and the response will hold. These are the situations that we are concerned with in the simple linear regression model.
Definition 19.1 (Response Variable (Dependent Variable)) The response variable is the variable that is treated as the outcome when considering a relationship between two or more variables. The response variable is treated as being dependent on the other variables being considered. It is the variable that the model is attempting to explain.
Definition 19.2 (Predictor Variable (Explanatory Variable; Independent Variable)) The predictor variable (or predictor variables, if using more than one) are the variables that are used to predict or explain the variation in the response. These are variables that are treated as input to the relationship, and where the primary consideration of these variables is through their influence on the outcome.
19.2 The Simple Linear Regression Model
19.2.1 Approximating Linear Relationships
In the case of modelling the relationship between two or more variables, we need to consider data collection as consisting of two or more records on the same unit. For simplicity, suppose we observe one outcome (\(y\)) and one predictor (\(x\)). Then, if we wanted to take a sample of \(n\) units from the population, the data we collected would consist of pairs, \((x_i, y_i)\) for \(i=1,\dots,n\). That is, we would take \(\{(x_1,y_1), (x_2, y_2), \dots, (x_n, y_n)\}\). In this case, \(x_1\) is the predictor for the first unit, and \(y_1\) is the outcome for the first unit; \(x_2\) is the predictor for the second unit, and \(y_2\) is the predictor for the second unit; and so forth. We can conceive of this data collection procedure in much the same way that we have conceived of all data collection procedures to date. Namely, \(x_1,\dots,x_n\) are realizations of some random variable, \(X\), that has some population distribution, and \(y_1,\dots,y_n\) are realizations of \(Y\) with some other population distribution. If we are concerned with the relationship between \(X\) and \(Y\), then we are working from the assumption that \(X\) and \(Y\) are not independent of one another. It is also convention to use \(X\) and \(Y\) to describe the explanatory and response variables, respectively.
Even in settings where a perfect linear relationship between two or more variables is theoretically justified, in collected data we will not often observe an exact linear relationship. Suppose we are measuring the distance traveled, when traveling at a constant speed, across multiple points in time. There will be some level of uncertainty in our measures of the distance traveled, either because we have made mistakes, or because our instruments for measuring distance are not perfect, or because there is a finite amount of precision that can actually be detected by the tools. The same issues are likely to impact our measures of time. Moreover, it is likely not possible to travel at exactly constant speeds, and so the underlying assumptions generating the exact linear model will likely not hold, precisely. However, we should still find that, in this case, a linear model will do a fairly good job of capturing the relationship between distance and speed.
When we have other quantities, specifically quantities where there may not be a theoretically justified linear relationship between the response and predictor, it may still be the case that a linear relationship can approximate the dependence between the variables. One technique for assessing the appropriateness of a linear relationship is through the use of scatter plots. Scatter plots are plots of bivariate data, where the values of one variable are plotted along the \(x\)-axis and values of a second variable are plotted along the \(y\)-axis. Each observation, \((x_i, y_i)\) is then plotted as a single point at the corresponding location on the plane. By investigating the relationship displayed in the plot, we can observe whether or not a linear relationship appears appropriate. By convention, we will place the outcome on the \(y\)-axis and the predictors on the \(x\)-axis.
Definition 19.3 (Scatter Plot) A scatter plot is a visual display of bivariate data in which observations are plotted at the Cartesian coordinates of their observed location. Typically, the \(x\)-axis will be used for the independent factors, and the \(y\)-axis will be used for the dependent factors.
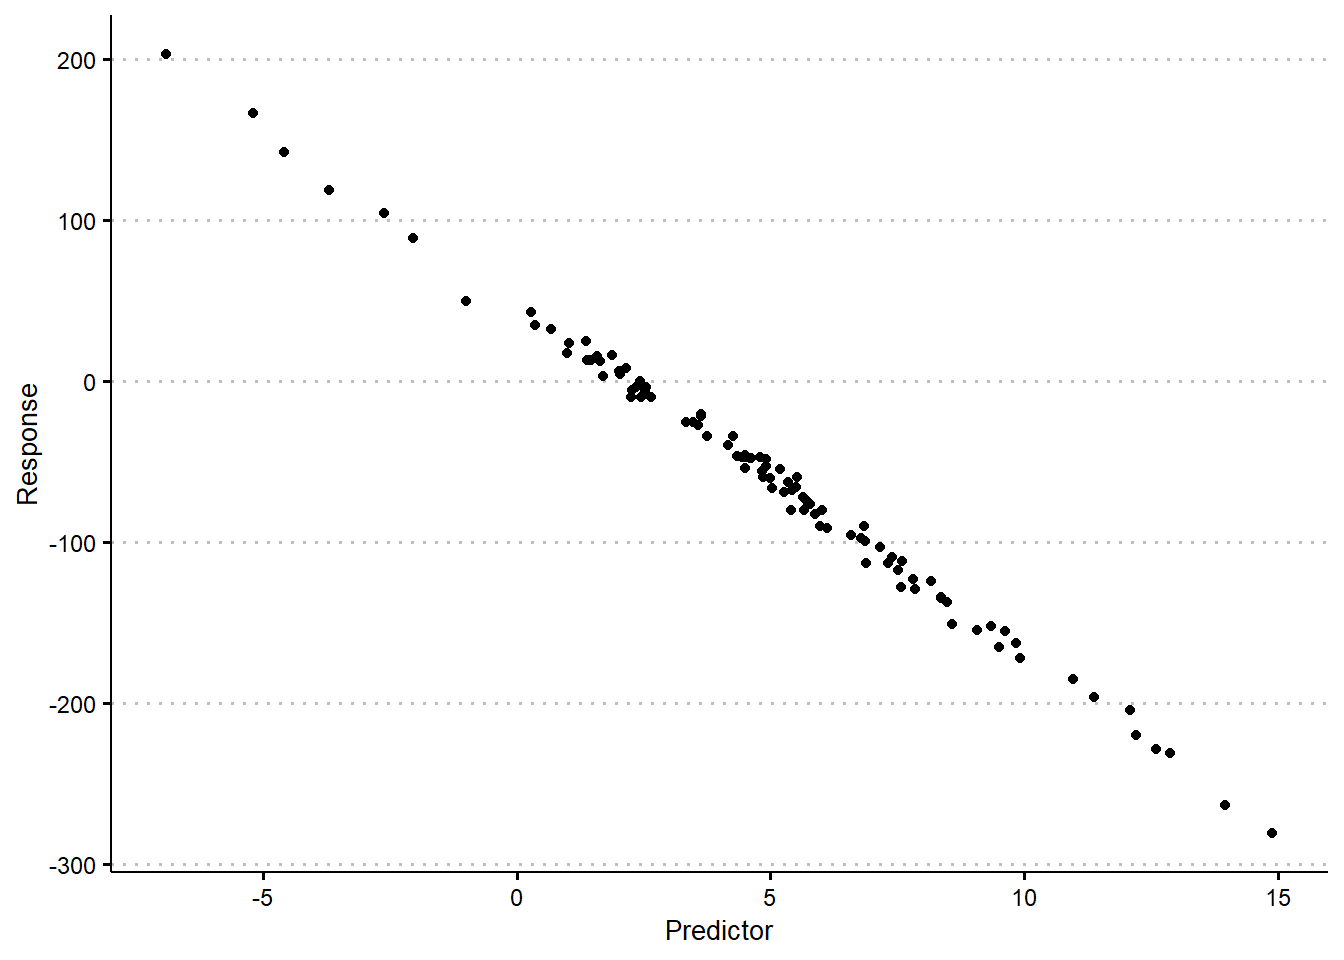
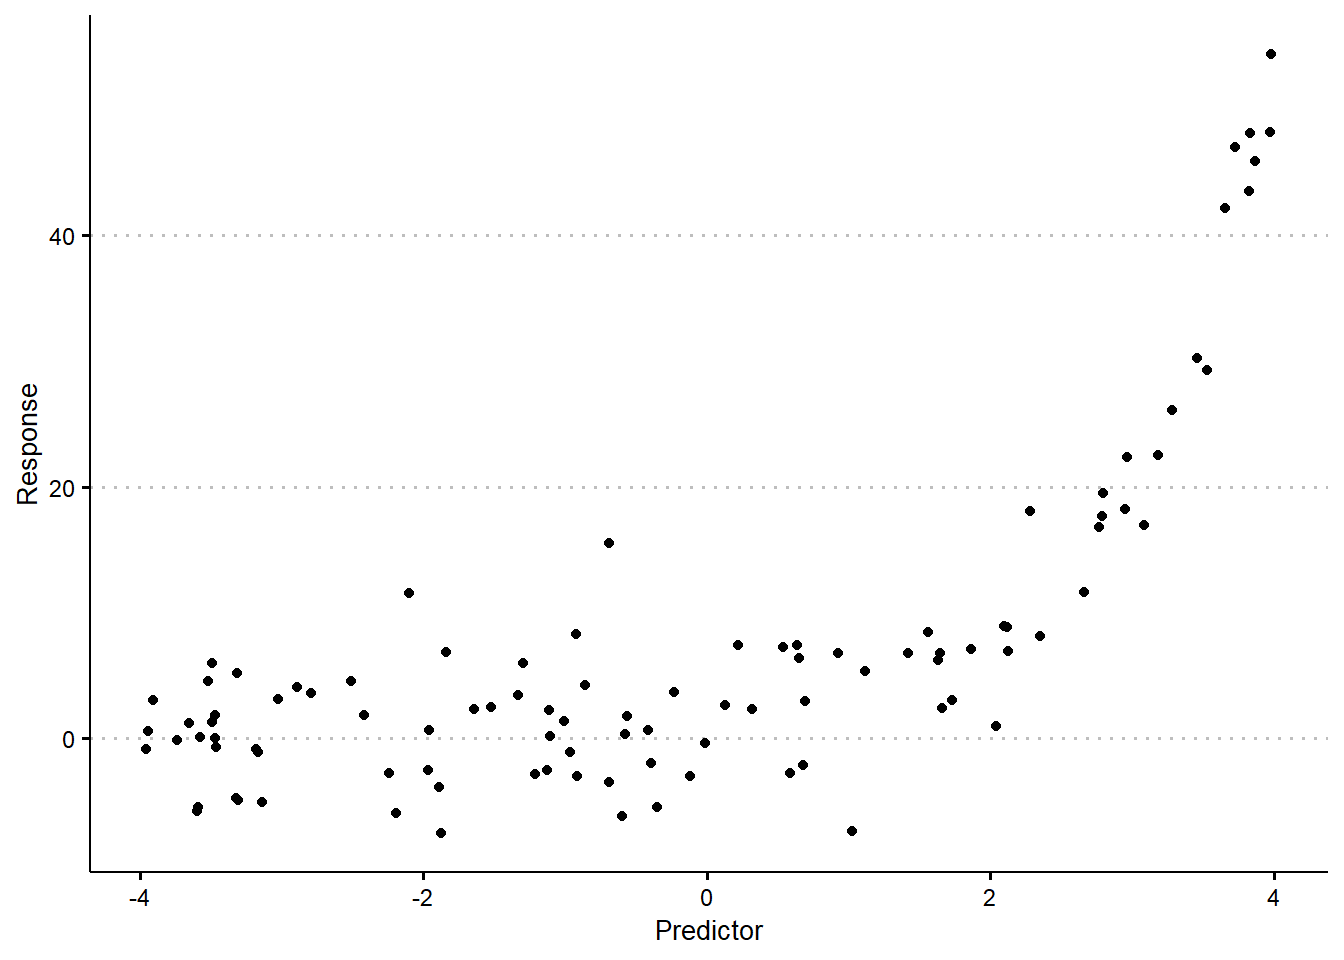
By considering the scatter plot, we can determine whether there appears to be an approximate linear relationship between the response and the predictors. Recognizing the sampling variability that is inherent to all data, we need not observe a perfect linear relationship. As long as a straight line appears to capture a dominant component of the trend, it is possible to use a linear model to represent the relationship between the variables. In cases where a linear relationship is entirely inappropriate, it may be the case that we observe patterns that appear to follow some other functional, non-linear relationship. For instance, it is common to see data that appear to exhibit the relationship \(y \approx e^x\), or \(y \approx \log(x)\), or perhaps \(y = x^2\). In each of these cases, we may still be able to present the data as having an approximately linear relationship if we transform the outcome. In the above examples, this corresponds to stating that \(\log(y) \approx x\), or \(e^y \approx x\), or \(\sqrt{y} \approx x\) (see Figure 19.2).3
If you have established that the relationship between a response and a predictor appears to follow an (approximately) linear relationship, the natural follow-up question is how we determine specifically what that relationship is. Naturally, given a plot that demonstrates an approximately linear relationship, we can likely draw-in the line of best fit using our intuition. Informally, the line of best fit will be the straight line that best explains the pattern we see in the data. That means it will get as close to as many of the points as possible, while not exhibiting a systematic bias, trying to balance the points that are over- and under-estimated. To find this line, formally, we can leverage simple linear regression.
19.2.2 The Model and Assumptions
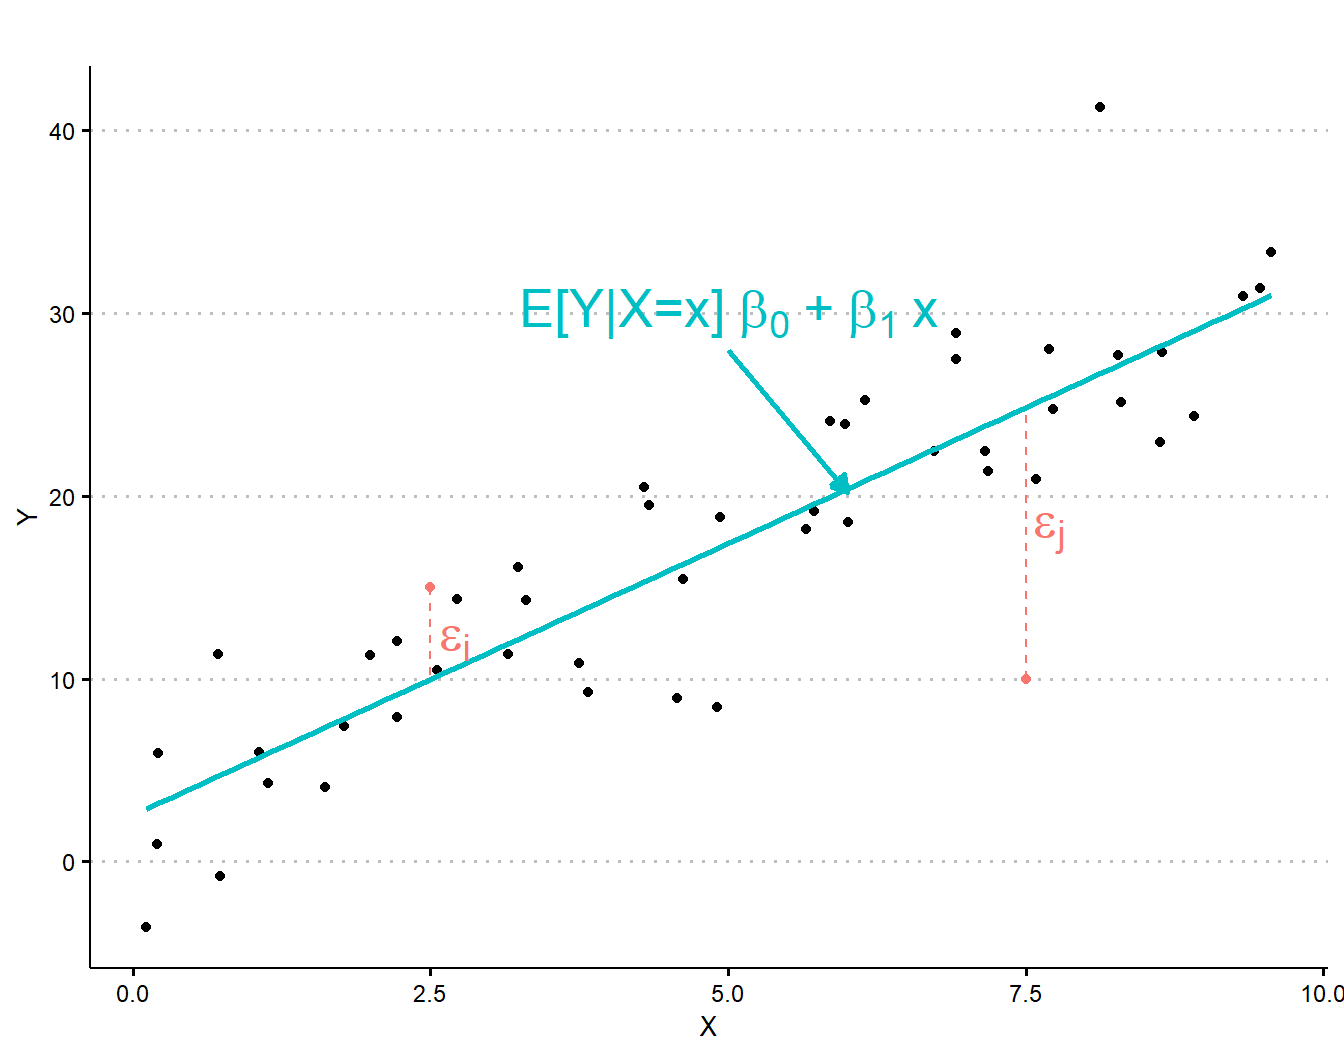
At its core, a linear regression model is a mathematical model for the conditional mean of the response variable. Namely, with simple linear regression we stipulate that \[E[Y|X=x] = \beta_0 + \beta_1 x.\] Here, \(\beta_0\) takes the role of the intercept parameter, and \(\beta_1\) takes the role of the slope parameter. That is, instead of indicating that \(Y\) follows an exactly linear relationship, we say that on average \(Y\) will be linear (in \(x\)). Because the average of \(Y\) given \(X=x\) is linear, we know that the actual observations of \(Y\) will fall around this line, either higher or lower depending on sampling variability. We also know that they should not be biased towards one side or the other, as on average, they will sit on the line. As a result, we will typically postulate that \[Y = \beta_0 + \beta_1 X + \epsilon,\] where \(\epsilon\) is a random variable, not dependent on the value of \(x\), such that \(E[\epsilon] = 0\) and labeling \(\text{var}(\epsilon) = \sigma^2\). We will typically refer to \(\epsilon\) as the error term.
From this assumption, we can re-derive that \(E[Y|X=x] = \beta_0 + \beta_1 x\). Note that this model is referred to as the simple linear regression model, since it has only a single predictor variable. If we specify multiple predictor variables in otherwise the same form, this remains a linear regression model, however, it is no longer labeled “simple”.
Definition 19.4 (Simple Linear Regression Model) A simple linear regression model is a statistical model specified for the conditional mean of a response variable, conditioned on a single explanatory variable. The model postulates that the conditional mean of the response is a linear function of predictor, such that \(E[Y|X=x] = \beta_0 + \beta_1 x\).
The key assumption when using linear regression is that this mean relationship, that \(E[Y|X=x] = \beta_0 + \beta_1 x\), is a good representation of the truth. Without linearity of the mean, using a linear regression will provide misleading results. Implicitly, this also means that we are taking \(Y\) to be a continuous variable.4 A secondary assumption that we have made implicitly in the specification of this model is that the amount of variability in the error term does not depend on \(X\). This assumption is called homoscedasticity and is typically summarized as being an assumption of constant variance.5 Mathematically, we can frame this as assuming that \(\text{var}(\epsilon|X=x) = \sigma^2\), for any value \(x\).
Definition 19.5 (Homoscedasticity (assumption)) The assumption of homoscedasticity (often expressed as saying that the data are homoscedastic), requires that the variance of the error terms in a model do not depend on the predictors in that model. That is, there is a constant variance across all observations in the model.
By assuming that \(E[Y|X=x] = \beta_0 + \beta_1 x\), and that otherwise, \(Y = E[Y|X=x] + \epsilon\), where \(\epsilon\) has mean \(0\) and does not depend on the value of \(X\), then this model has specified the parametric form for \(Y|X=x\). Namely, \[E[Y|X=x] = \beta_0 + \beta_1 x \quad\text{ and }\quad \text{var}(Y|X=x) = \sigma^2.\] It is this random variable, \(Y\), that we are primarily concerned with, conditional on \(X\). Note that sometimes it will be convenient to make further assumptions regarding \(\epsilon\). Most commonly, we may assume that \(\epsilon \sim N(0, \sigma^2)\). Under this assumption, we end up further assuming that \[Y|X=x \sim N(\beta_0 + \beta_1 x, \sigma^2).\] This assumption is not necessary for the estimation of the regression parameters, \(\beta_0\) and \(\beta_1\), but it will be useful if we wish to conduct inference regarding the parameters.
19.2.3 Estimation of Model Parameters
Estimation in the simple linear regression refers specifically to estimation of the parameters, \(\beta_0\) and \(\beta_1\). Under the specified model, with estimates for both the intercept and the slope, the procedure provides an estimate of the line of best fit, and equivalently, for the conditional mean of \(Y\) given \(X=x\). Denote the estimators for \(\beta_0\) and \(\beta_1\) as \(\widehat{\beta}_0\) and \(\widehat{\beta}_1\), respectively. Then, if estimates for these quantities were worked out, we could also write \[\widehat{E}[Y|X=x] = \widehat{\beta}_0 + \widehat{\beta}_1x.\] That is, the estimated conditional mean, given some value of \(x\), can be derived through these estimators.
In the data that we have observed, we will have \(\{(x_1, y_1), \dots, (x_n, y_n)\}\) observed in pairs. If we apply our estimated relationship, \(\widehat{\beta}_0 + \widehat{\beta}_1x_i\) to any specific individual, if the estimators are well-behaved then this should be close to the true value, \(y_i\). We will typically write \[\widehat{y}_i = \widehat{E}[Y|X=x] = \widehat{\beta}_0 + \widehat{\beta}_1x.\] In a sense, the difference between \(y_i\) and \(\widehat{y}_i\) is the “mistake” that the estimated regression line makes on the specific individual. It is the amount of the outcome that is not captured by the regression model. We refer to these quantities as the residuals.
Definition 19.6 (Residuals (Regression Model)) Broadly speaking residuals refer to the difference between the true value of an outcome, and the value of the outcome that is implied by the estimated model. For simple linear regression, the residuals for an individual with predictor \(x_i\) and outcome \(y_i\) are given by \[e_i = y_i - (\widehat{\beta}_0 + \widehat{\beta}_1x_i) = y_i - \widehat{y}_i.\] The residuals can be viewed as estimated values for the errors, \(\epsilon_i\), since if \(\widehat{\beta}_0 = \beta_0\) and \(\widehat{\beta}_1 = \beta_1\), then \(e_i = \epsilon_i\).
Intuitively, in order to have the line of best fit, we want to have the residuals be as small as possible across the entire dataset. Importantly, however, we want to consider both positive and negative residuals as being equally far from the truth. If the value implied by the model is \(10\) units larger than the truth, or if the value implied by the model is \(10\) units smaller than the truth, these both constitute an error of \(10\) units. As a result, instead of \(e_i\) alone, we will consider the squared residuals, \(e_i^2\). Specifically, the line of best fit, the estimated regression line, will be defined by the parameters that minimize the sum of the squared residuals.
Definition 19.7 (Estimated Regression Line (Line of Best Fit)) The estimated regression line, also referred to as the line of best fit, is the line that is estimated from a set of data based on \(\widehat{\beta}_0\) and \(\widehat{\beta}_1\). This line is taken to be the line that minimizes the sum of squared residuals. Namely, the estimated regression line is defined by finding \(\widehat{\beta}_0\) and \(\widehat{\beta}_1\) such that \[\sum_{i=1}^n e_i^2 = \sum_{i=1}^n (y_i - \widehat{\beta}_0 - \widehat{\beta}_1x_i)^2,\] is minimized. This procedure is referred to as the least squares procedure, or sometimes, ordinary least squares.
Through the least squares procedure, the line of best fit can be derived. In the case of linear regression, the estimators \(\widehat{\beta}_0\) and \(\widehat{\beta}_1\) take on a specific form, based on the observed data.
The line of best fit, in the simple linear regression, then depends on only the sample means of both \(x\) and \(y\), as well as on the sample variance of \(x\) and the sample covariance of \(x\) and \(y\). From these quantities, we are able to derive the closed form estimators for the intercept and slope parameters, which in turn define the estimated regression line. The estimated regression is as such taken to be the best line in the sense that the sums of the squared residuals will be minimized among all possible linear relationships.6 With the estimated linear relationship found, we can turn towards considering interpretation and inference for the parameters and overall relationship.
19.2.4 Interpretation and Inference Regarding Model Parameters
In the deterministic linear relationship, \(y = mx + b\), \(b\) was interpreted as the \(y\)-intercept, which is to say the value of \(y\) when \(x=0\), and \(m\) was interpreted as the slope, which is to say the change in \(y\) for a \(1\) unit change in \(x\). These interpretations carry over to the coefficients in the linear regression model. The key distinction is that in the deterministic relationship these are exact. For the linear regression model we must remember that \(\beta_0 + \beta_1 x\) is a model for the mean of \(Y\) given \(X=x\). That is, our interpretations will not center on the values of \(Y\) specifically, but rather on the average values of \(Y\).
To understand the interpretation of the parameters, we can consider separate points that isolate the parameters themselves. First, consider what happens for a data point that has \(X = 0\). In this case we find, \[E[Y|X=0] = \beta_0 + \beta_1(0) = \beta_0.\] Thus, the expected value of \(Y\) when \(X\) is \(0\) is exactly equal to the intercept, \(\beta_0\). As a result, in order to interpret \(\beta_0\), we can suggest that it is the mean of the outcome when the predictor is \(0\). Next, consider two different points. If we first take \(X=x\), and then consider a second point with \(X=x+1\), then we can take the difference between these two quantities. This gives \[\begin{align*} E[Y|X=x] &= \beta_0 + \beta_1x \\ E[Y|X=x+1] &= \beta_0 + \beta_1(x + 1) \\ &= \beta_0 + \beta_1x + \beta_1 \\ E[Y|X=x+1] - E[Y|X=x] &= \beta_0 + \beta_1x + \beta_1 - (\beta_0 + \beta_1 x) \\ &= \beta_1. \end{align*}\] Thus, \(\beta_1\) represents the change in the expected outcome when \(X\) increases by a single unit. In practice, we will not have the values of the parameters exactly, and so our interpretation will rely on estimates of these parameters. This means that we interpret \(\widehat{\beta}_0\) as an estimate of the average value of the outcome when the predictor is \(0\), and we interpret \(\widehat{\beta}_1\) as an estimate of the average change in the outcome for a \(1\) unit increase in the predictor.
It is important to note that whether the parameters have interpretations that are substantively interesting depends on the specific context. For instance, it may be the case that \(X=0\) is not a meaningful quantity, depending on what \(X\) measures. Consider if the regression model is predicting some health outcome using blood pressure as the predictor, \(X\). In this case, it is not particularly meaningful to predict the health outcome if \(X=0\). There are other cases where the prediction may be reasonably assumed to equal \(0\), but this is not an interesting case. Consider, for instance, if \(Y\) represents the revenue that a company will earn based on the amount that they spend on advertising (\(X\)). It is unlikely that the company will spend \(0\) on advertising in any situation, and as a result, the intercept becomes of little interest. Similar considerations can occur for the slope parameter as well. In particular, if a \(1\) unit change in the predictor is unrealistic or uninteresting, then the slope parameter does not have a particularly interesting meaning. Consider, for instance, any regression model that relies on a proportion as a predictor. In this case, \(X \in [0,1]\), and so most changes of \(X\) will not be of size \(1\). Alternatively, consider a regression model that relies on annual income as a predictor, measured in dollars. In this case, a \(\$1\) change in income is not likely a sizable enough effect to care deeply about.
To avoid concerns with the scale of the predictor being off, either because \(1\) unit change is too large or too small, we can adjust the linear regression model in one of two ways. First, we can transform the predictors so that they are measured on a scale where a \(1\) unit change is meaningful. This relies on multiplying or dividing all the observations of \(X\) by some constant. Consider, for instance, the proportions example. Measured as a value between \(0\) and \(1\), a \(1\) unit change is unreasonable. However, if we multiply all the proportions by \(100\), then our predictors are measured as percentages instead. In this case, a \(1\) unit change corresponds to a \(1\%\) change, which is more likely to be relevant. Similarly, in the income example, we could perhaps measure income in thousands of dollars. To do so, we would divide \(X\) by \(1000\). Then, a \(1\) unit change in the predictor corresponds to a \(\$1000\) change in income, which is more likely to be relevant. If we scale the predictors up or down, the estimated parameter values for the intercept will not change. Moreover, the slope value will be scaled by the same constant, in the opposite way. If we multiply \(X\) by \(100\), the newly estimated \(\beta_1\) will be \[\widehat{\beta}_1^\text{new} = \dfrac{\widehat{\beta}_1}{100}.\] Similarly, if we divide \(X\) by \(1000\), then the newly estimated \(\beta_1\) will be \(\widehat{\beta}_1^\text{new} = 1000\times\widehat{\beta}_1\). As a result, we need not actually refit the regression model with the transformed predictors. Instead, we can scale up or down the estimate to operate on a scale that is more relevant.
A mathematically equivalent, but conceptually distinct, method of reinterpreting the slope coefficient returns to the initial method used to determine the meaning of the parameters. Recall that we considered two separate data points, one with \(X=x\) and one with \(X=x+1\). If a difference of \(1\) is not meaningful, then we could have instead considered a difference of \(\delta\), for some \(\delta\) that is meaningful. For instance, in the proportion example perhaps \(\delta = 0.01\), and in the income example perhaps \(\delta = 1000\). Then, using the same strategy as before, \[\begin{align*} E[Y|X=x] &= \beta_0 + \beta_1x \\ E[Y|X=x+\delta] &= \beta_0 + \beta_1(x + \delta) \\ &= \beta_0 + \beta_1x + \delta\beta_1 \\ E[Y|X=x+1] - E[Y|X=x] &= \beta_0 + \beta_1x + \delta\beta_1 - (\beta_0 + \beta_1 x) \\ &= \delta\beta_1. \end{align*}\] As a result, we can say that \(\delta\beta_1\) is the expected change in the outcome for a \(\delta\) unit increase in the predictor. This results in the same scaling as before, but in certain settings, it may be clearer to envision.
The interpretations of the parameter estimates do not explicitly account for the uncertainty in estimation. If we had access to the true parameter values, \(\beta_0\) and \(\beta_1\), we would be able to directly interpret the values as outlined. Unfortunately, the estimators are subject to the same uncertainty that all estimators are. As such, it is important to consider the sampling distribution of the parameters, and use this to quantify our uncertainty in the values of the parameters.
Without assuming normality, we can derive the expected value and variance of the two estimators. Importantly, both \(\widehat{\beta}_0\) and \(\widehat{\beta}_1\) are unbiased estimators of the truth, meaning \[E[\widehat{\beta}_0] = \beta_0 \quad\text{ and }\quad E[\widehat{\beta}_1] = \beta_1.\] For the variances, each of them depends on the overarching variance of the error terms, \(\sigma^2\). Specifically, \[\text{var}(\widehat{\beta}_0) = \sigma^2\left(\frac{\sum_{i=1}^nX_i^2}{n\sum_{i=1}^n(X_i - \overline{X})^2}\right) \quad\text{and}\quad \text{var}(\widehat{\beta}_1) = \sigma^2\left(\frac{1}{\sum_{i=1}^n(X_i - \overline{X})^2}\right).\] Under the assumption that the errors are normal7 then regardless of the sample size, the sampling distribution of the parameters will also be normal. In the case of a large sample then the sampling distributions will be approximately normal, regardless of the distribution of the errors. These sampling distributions can be used to construct confidence intervals for the parameters, or to conduct hypothesis tests regarding their values.
Because the parameters are normally distributed, statistical inference from the normal distribution applies. Specifically, both confidence intervals and hypothesis tests can be conducted using a normal distribution, when \(\sigma^2\) is assumed to be known, and using a \(t\) distribution if \(\sigma^2\) is replaced by its estimated value. Specifically, if we denote the standard errors of \(\widehat{\beta}_0\) and \(\widehat{\beta}_1\) as \(SE(\widehat{\beta}_0)\) and \(\widehat{\beta}_1\),8 then a \(100(1-\alpha)\%\) confidence interval is given by \[\widehat{\beta}_j \pm Z_{\alpha/2}SE(\widehat{\beta}_j),\] if \(\sigma^2\) is known, and otherwise, by \[\widehat{\beta}_j \pm t_{n-2,\alpha/2}\widehat{SE}(\widehat{\beta}_j).\] These results also directly permit the use of \(Z\)-tests or \(t\)-tests for the values of the parameters. Notably, if the null hypothesis is \(H_0: \beta_j = c\), then \[\frac{\widehat{\beta}_j - c}{SE(\widehat{\beta}_j)} \stackrel{H_0}{\sim} N(0, 1) \quad\text{and}\quad \frac{\widehat{\beta}_j - c}{\widehat{SE}(\widehat{\beta}_j)} \stackrel{H_0}{\sim} t_{n-2}.\]
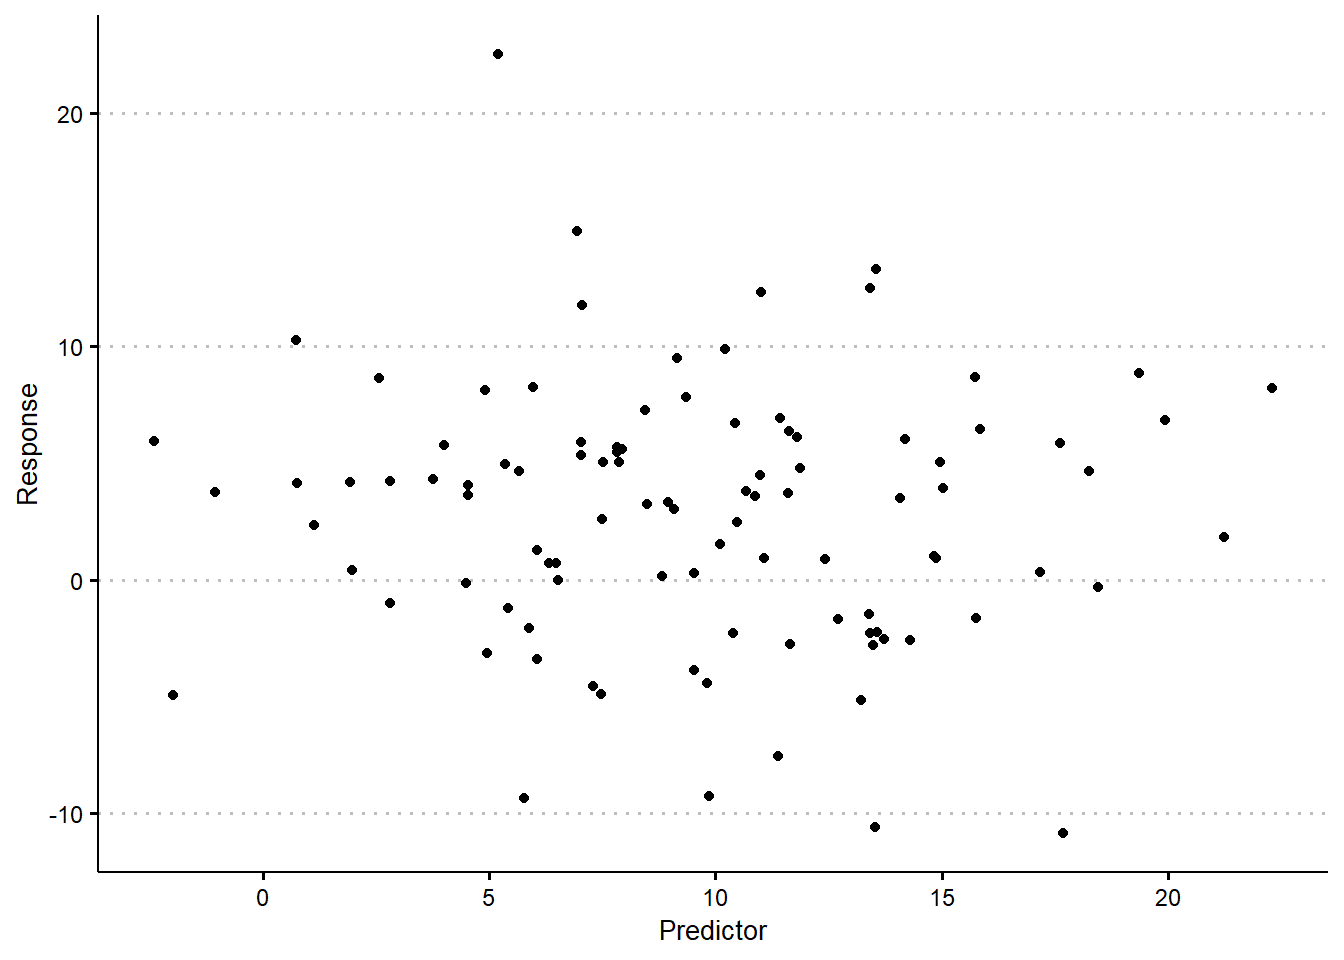
These results are powerful as they permit the entirety of our study on \(t\)-tests and \(Z\)-tests, as well as on the relevant confidence intervals, to apply directly to the regression parameters. Conceptually, it is no different to find the confidence interval for the slope (or intercept) in a regression, as it is to find the confidence interval for a sample mean. Similarly, the test procedure for the regression procedures is equivalent, once the parameters have been estimated, as it is for the sample mean. When considering hypothesis tests we will typically focus on tests of the slope parameter, rather than tests of the intercept. Moreover, it is most typical to see tests of the null hypothesis \(H_0: \beta_1 = 0\), versus the two-sided alternative. If \(\beta_1 = 0\), then the conclusion that we would draw is that there is no relationship9 between the outcome and the predictor. This is typically interpreted as saying that the predictor does not have an effect on the outcome, though, we must be cautious with such language as a hypothesis test in a regression does not necessarily constitute an assessment of causality.
In the case of an unknown error variance10 then there are two important considerations to make. The first is that the sampling distribution is given by a \(t\) distribution with \(n-2\) degrees of freedom. This differs from the case of the sample mean, where we considered a \(t\) distribution with \(n-1\) degrees of freedom. The second is that, in order to estimate the standard error of either estimator, we require an estimator for the variance of the error terms, \(\widehat{\sigma}^2\). In order to estimate the error variance, we turn towards considering a breakdown of the sources of errors in the regression model as a whole.
19.3 Sources of Variation in Simple Linear Regression
One way to view a regression model is as an attempt to explain the variability in the outcome variable using the predictor. Since \(Y\) is a random quantity, we know that there is inherent variability in \(Y\), say, captured through its variance. In the sample that we obtain, we have estimated this variability using the sample variance before. An alternative method of representing the variability in the sample is to use the total variation, \[\text{SST} = \sum_{i=1}^n (y_i - \overline{y})^2.\] This is the same as the sample variance, except we are not scaling the amount of variability by \(n-1\). We refer to this as the sum of squares total or the total sum of squares, and it represents the total variability in the outcome within our sample.
Definition 19.8 (Sum of Squares Total (SST)) The total sum of squares is the sum of all squared differences between the observations of the outcome, and the overall mean of the outcome, within a sample. It measures the complete variability within a sample, and is calculated as \[\text{SST} = \sum_{i=1}^n (y_i - \overline{y})^2.\]
The goal with the regression model is then to explain as much variability in the outcome as is possible, using the explanatory factor. Assuming that the linear regression model is the correct expression of the conditional mean then this will explain some portion of the differences between various observations of \(Y\). That is, if we take two observations in our data, \((x_i, y_i)\) and \((x_j, y_j)\), then we expect that \(y_i \neq y_j\). In part this occurs if \(x_i \neq x_j\), since \(E[Y|X=x] = \beta_0 + \beta_1x\), and so there is an expected difference of \(\beta_1(x_i - x_j)\). These differences can be explained by the regression model. Beyond these differences, however, there is likely to be further differences between the observations. These come from the errors in the model.
Consider, \(y_i - y_j\), if we do not take expectations, this will give \(\beta_1(x_i - x_j) + (\epsilon_i - \epsilon_j)\). Thus, even if \(x_i = x_j\), we will likely not observe \(y_i = y_j\) because of the error terms. The variability owing to the errors cannot be explained by the model, since the errors are purely random and not dependent on the explanatory factors. Recall that we defined the residuals to be \(e_i = y_i - \widehat{y}_i\). Notice that, if \(\widehat{\beta}_0 = \beta_0\) and \(\widehat{\beta}_1 = \beta_1\), we have that \(e_i = \epsilon_i\). In a sense then, the residuals can then be seen as estimates of the errors. As a result, if we take the sum of squared residuals, this gives an estimate of the total variation from the errors, resulting in \[\text{SSE} = \sum_{i=1}^n e_i^2.\] This is referred to as either the residual sum of squares, or the error sum of squares, or sometimes the sum of squared errors.
Definition 19.9 (Residual Sum of Squares (Sum of Squared Errors; SSE)) The residual sum of squares is a measure of the amount of variability in the outcomes of a linear regression model that is not explained by the model itself. That is, it is the residual variability, after accounting for the explanatory factors. The residual sum of squares is computed as \[\text{SSE} = \sum_{i=1}^n e_i^2.\]
If the total sum of squares, \(\text{SST}\), gives the complete variability in the outcome, and the residual sum of squares, \(\text{SSE}\), gives the variability in the outcome that is left unexplained by the model, then the difference between these two quantities gives the amount of variability that is explained by the model. That is, \(\text{SSR} = \text{SST} - \text{SSE}\), where \(\text{SSR}\) refers to the regression sum of squares. The regression sum of squares gives a measure of the explainable component of the variability in the outcome.
Definition 19.10 (Regression Sum of Squares (SSR)) The regression sum of squares is the amount of variability in the outcome that can be explained by the regression model. This captures how much variability is described by the explanatory factors. The total variability is made up of the regression sum of squares and the residual sum of squares, so that \(\text{SST} = \text{SSE} + \text{SSR}\), and this relationship can be used to write \[\text{SSR} = \text{SST} - \text{SSE}.\]
With the framing of regression as breaking down the source of variation, we are able to both estimate variance components that are of interest for inferential purposes, and diagnose how well the model seems to fit or explain the observations. In order to conduct statistical inference in the event of an unknown error variance, we required an estimator for the variance of the error terms, denoted \(\sigma^2\). Noting that the residual sum of squares approximates the total variability within the error terms, we can scale this to give an estimate of the error variance. Namely, we take \[\widehat{\sigma}^2 = \text{MSE} = \frac{SSE}{n - 2}.\] Here, \(\text{MSE}\) refers to the mean squared errors.
Definition 19.11 (Mean Squared Error (MSE)) The mean squared error refers to an estimate of the residuals of the error terms. This estimate is derived as a scaled version of the sum of squared errors, where the \(\text{SSE}\) is scaled by the total sample size less the number of estimated parameters in the model. In the case of a simple linear regression model there are \(2\) estimated parameters and so \[\text{MSE} = \frac{\text{SSE}}{n-2}.\]
The breakdown of sources of variance can also provide a method of understanding the overall quality of the regression model. One common technique for doing this is through the use of the coefficient of determination or the \(R^2\) value. The coefficient of determination gives a measure of the proportion of variation that is explained by the regression model, with the idea that generally speaking, it is preferable when a model explains more variation than less.
Definition 19.12 (Coefficient of Determination (\(R^2\))) The coefficient of determination is a measure of the proportion of the variation in the outcome that is attributed to the regression sum of squares. This measure is typically denoted \(R^2\), such that \[R^2 = \frac{\text{SSR}}{\text{SST}}.\] Note that \(0 \leq R^2 \leq 1\), and as \(R^2\) nears \(1\), the model explains more of the variability in the outcomes.
The \(R^2\) is an incredibly popular measure to be reported alongside the results of a linear regression model. The prominence makes it important to understand. With that said, the \(R^2\) is often misused or misinterpreted, and as a result, great care should be taken when encountering the \(R^2\) values. What follows are some frequent misinterpretations or mistakes regarding the \(R^2\) value, and an attempt to illustrate why these are mistakes.11
- \(R^2\) is often used a measure of goodness of fit. It is not. Note that goodness of fit refers to a measure of how well the model tracks with reality. We know that in practice the mean of \(Y\) given \(X=x\) is unlikely to be precisely \(\beta_0 + \beta_1x\), however, we hope that it is close. Measures of goodness of fit tell us whether the model appears to fit or not. Many individuals use \(R^2\) as a measure of the goodness of fit, however, this is inappropriate. The \(R^2\) value can be made to be arbitrarily small for a model that is exactly correct, for instance, by increasing the variability of the error terms. On the flip side, there is no upper bound on how high the \(R^2\) value can be when the model is entirely wrong – it can be arbitrarily close to \(1\).
- The \(R^2\) is often used to compare across different datasets. It cannot be. The \(R^2\) is a data-dependent measure. If you take two different sources of data and compare regression models fit on each of them, the \(R^2\) values are entirely incomparable. If you are comparing two different models fit to the same data, then in this case, \(R^2\) can be compared, however, any conclusions could also be derived at by comparing (say) the \(\text{MSE}\) (a more useful measure).
- The \(R^2\) value is often thought to describe causality. It does not. The phrasing “the fraction of variance explained” is a misleading phrase at best. When this language is used, it is meant to say that the \(R^2\) gives the proportion of the total variation that is made up by the variation in the regression model. This is not to say that a high \(R^2\) means that the explanatory factor is a good explanatory factor of the outcome, nor to say that there is some causal connection between these components. In fact, if we fit two regression models, one where \(Y\) is treated as the outcome and \(X\) as the explanatory factor, and then a second where the roles are reversed (\(X\) is treated as the outcome and \(Y\) the explanatory variable), the \(R^2\) in each of these models will be exactly equivalent. As such, \(R^2\) can certainly not capture any “explanation” in a scientific sense of the word.
The \(R^2\) will not typically be a particularly useful quantity to report. However, its prominence is not likely to be minimized at any point in the near future. Correspondingly, it is important to understand what \(R^2\) is, and also critically, what it is not.
19.4 Prediction using Linear Regression
To define the residuals, we introduced \(\widehat{y} = \widehat{\beta}_0 + \widehat{\beta}_1x\). This was thought of as the estimated expected value of \(Y\) given \(X = x\). Expressed in this way, this is an estimation procedure like any other that we have seen. That is, we are estimating the parameter of a population distribution12 using observed data. However, the notation is suggestive of an alternative perspective. Notably, suppose that beyond our sample we make a new observation with \(X=x\), but we do not observe the corresponding value of \(Y\). In this case, we can use the same relationship, \(\widehat{\beta}_0 + \widehat{\beta}_1x\) to make a guess as to the unobserved value for the outcome. Notice that this framing of the estimation problem is distinct from estimation problems we have previously seen. In this case, we are attempting to use data to guess the value of a variable outside the data that we have collected. When we use estimation in this context, we no longer refer to it as estimation but instead as prediction.
Definition 19.13 (Prediction) In statistics, prediction refers to the process of using data to guess the value of a random quantity that was not observed in the sample. The specific values are typically informed through observed data. The numeric values themselves are referred to as predictions, while the functions that generate the predictions can be referred to as predictors.13
One of the most useful features of linear regression is the ability to generate predictions from the estimated regression function. The process of prediction is a very important application of statistics. Critically, with prediction, we are able to make guesses beyond the samples that we have actually recorded. This allows data in the present to inform our understanding of the future, helping to make decisions or guide action. With prediction we must be cautious, however, as we are relying on the past to be a good representation of the future. If the patterns from the past fail to hold moving forward then prediction will be invalid. Moreover, if the value of the dependent variable is far from values that were actually seen in the data, there is no way to assess the quality of prediction. These types of predictions are known as extrapolations.
Definition 19.14 (Extrapolation) When prediction occurs beyond the scope of the model, this is known as extrapolation. Specifically, extrapolation refers to predictions that are made for values of the explanatory factors that were not observed, or which are far from values that were observed, in the initial data used to fit the model. Extrapolation is typically ill-advised, as its use cannot be supported via statistical theory.
The concern with extrapolation is that there is no way to determine whether the pattern over the observed range of the explanatory factors will continue beyond the current range. It is possible that what appears to be a linear relationship over the observed data ends up looking nonlinear over a wider range. Alternatively, perhaps there is a value of the explanatory variable after which a fundamentally new pattern emerges. Extrapolation relies on the thought that the observed trends will continue indefinitely, and this assumption tends to be fairly strong. In order to responsibly extrapolate beyond the scope of a model, the extrapolation should be supported by the subject-matter theory. If there are good theoretical reasons to believe that the same pattern will continue, or that the relationship will remain linear over the entire range of the explanatory factors, then extrapolation is better supported. Critically, however, these arguments do not come from statistical observation and instead rely on subject-matter knowledge.
As long as the use of prediction is supported, then we can view the regression function as providing the best guess as to the value of new, unobserved data. There is uncertainty in the predictions that we make. Just as with estimation, we should never expect the predicted values to exactly equal the unobserved values. Instead, we hope that we are close to the truth. With estimation, when faced with the reality of never exactly getting the value correct, we supplemented point estimation with interval estimation. The same general concept applies for prediction. We can find prediction intervals that give a range of values that are, in some sense, equally well-supported by the observed data.
Definition 19.15 (Prediction Interval) A prediction interval is an interval estimator calibrated to contain the value of an unobserved response, based on observed explanatory factors, with a set probability. The prediction interval supports the use of (point) prediction, giving a range of plausible values for the unobserved response.
To form the prediction interval for simple linear regression, we need to consider the variability of the prediction itself. Namely, if we take \[\widehat{Y} = \widehat{\beta}_0 + \widehat{\beta}_1X,\] for a set value of \(X\), then notice that the variance of this quantity is given by \[\begin{align*} \text{var}\left[\widehat{\beta}_0 + X\widehat{\beta}_1\right] &= \text{var}(\widehat{\beta}_0) + X^2\text{var}(\widehat{\beta}_1) + 2X\text{cov}(\widehat{\beta}_0, \widehat{\beta}_1) \\ &= \frac{\sigma^2\sum_{i=1}^nX_i^2}{n\sum_{i=1}^n(X_i - \overline{X})^2} + \frac{X^2\sigma^2}{\sum_{i=1}^n(X_i - \overline{X})^2} - \frac{2\sigma^2X\overline{X}}{\sum_{i=1}^n(X_i - \overline{X})^2} \\ &= \sigma^2\left(\frac{1}{n} + \frac{(X - \overline{X})^2}{\sum_{i=1}^n (X_i - \overline{X})^2}\right). \end{align*}\] If we wished to form confidence intervals around the estimated conditional mean of \(Y\) given \(X=x\), we could use the square root of this quantity as the variance, either using the true variance when known14 or else using the MSE as an estimate of the variance15. For the prediction interval, however, we are not looking to quantify the mean directly, but rather the actual observed outcome. Recall that \(Y = E[Y|X=x] + \epsilon\), where \(\epsilon\) is an error term, with variance given by \(\sigma^2\). As a result, the actual outcome should fall near \(E[Y|X=x]\), but will be perturbed by a noise term, \(\epsilon\), with variance \(\sigma^2\). Thus, to capture the variance of the predicted outcome, we ought to add an extra \(\sigma^2\) to the variability, \[\sigma^2 + \sigma^2\left(\frac{1}{n} + \frac{(X - \overline{X})^2}{\sum_{i=1}^n (X_i - \overline{X})^2}\right) = \sigma^2\left(1 + \frac{1}{n} + \frac{(X - \overline{X})^2}{\sum_{i=1}^n (X_i - \overline{X})^2}\right).\]
The relevant sampling distribution will still be normal, supposing that \(\sigma^2\) is known, or else a \(t_{n-2}\) if the MSE is used as an estimate for \(\sigma^2\).
19.5 Beyond Simple Linear Regression
Simple linear regression is characterized by the use of a single predictor to explain the outcome. The framework of linear regression, however, is far more broad. The most natural extension to simple linear regression is that of multiple linear regression, where in place of a single predictor, multiple predictors are used. In this setting the relationship between the outcome and the predictors remains linear, however, each predictor has its own slope coefficient. For instance, we may write \[E[Y|X_1=x_1, X_2=x_2, X_3=x_3] = \beta_0 + \beta_1x_1 + \beta_2x_2 + \beta_3x_3,\] and so forth. The same estimation procedure16 can apply to give estimates of the various parameters, and the same types of distributional results apply for inference, giving both confidence and prediction intervals. Statistical software will readily estimate regression lines with large numbers of predictors, and by including increasing numbers of explanatory factors, the model fit will correspondingly improve. The main difficulty with multiple regression, compared to simple linear regression, is that the parameters need to be interpreted with more care: by considering multiple factors at the same time, our interpretations also need to do so.
Other extensions to the framework of regression modeling exist as well. For instance, there are generalized linear models, that can take outcome variables that are not continuous, and fit them using linear functions. This is particularly useful if the outcome is, for instance, a binary indicator17 or count data.18 These generalized linear models require an expansion of the theory, but are based on many of the same underlying principles. Regression models can also move beyond linear functions of the predictors. There are nonlinear forms of regression that capture more complex relationships, whether the outcome is continuous or otherwise.
Fundamentally, regression modelling specifies a model for the conditional mean of an outcome, given some number of predictors. This is a very general problem, and there has correspondingly been a tremendous amount of development of techniques for addressing this concern. Many procedures in statistics, and questions in science more broadly, can be formulated through a regression framework. For this reason, regression remains an incredibly powerful tool to make use of, for both inference and prediction. Simple linear regression is useful in certain contexts, however, it can also be viewed as an approachable first-step towards understanding the broader world of regression modelling.
19.6 Linear Regression in R
Fortunately, R makes the computation of a linear regression – along with the testing of hypotheses surrounding the regression, straightforward to complete. The primary function of interest is the lm function, standing for a linear model. The lm function can take in many different parameters, however, the primary argument that is required is the model formula. In R, a formula is a special arrangement of variables which define a particular mathematical relationship. For instance, we may write lm(y ~ x). Here, y ~ x is the formula.
To read this formula we consider the left-hand side (to the left of ~) and the right-hand side (to the right of ~) separately. The left-hand side specifies the dependent variable, or the outcome. In this case, we are saying that the variable y contains the dependent observations. On the right-hand side, we include any explanatory factors of interest, so in this case, there is a single predictor, x. If R is to be used beyond simple linear regression, we may write, for instance, lm(y ~ x1 + x2 + x3), to fit a model where y is explained by x1, x2, and x3. Note that, by default, a formula in R will include an intercept. That is, we do not need to include an explicit term specifying to fit \(\beta_0\), as R will do this by default.
The variables passed into the formula can be variables that exist in the environment broadly, or, they can be columns of a dataframe. If we have defined a dataframe with a column, my_df$outcome and another, my_df$predictor then the linear model can be fit using the call lm(outcome ~ predictor, data = my_df). Here, the variables in the formula will be drawn from the dataframe passed in as the data argument, but otherwise they are read the same way. This is particularly useful as it enables us to collect and store data in one location, and then fit the regression model directly to these data.
Once a regression model has been fit, the object itself contains a great deal of information. Most of this can be read via the summary function. This will output a thorough summary of the regression, including the coefficients, their standard errors, \(t\)-tests of the hypotheses that they are actually equal to \(0\), as well as the mean squared error, degrees of freedom, and \(R^2\) value (among other reported quantities). When it is only the estimated coefficients that are of interest, coef will return a named vector of the parameters in the model. Beyond summary, the predict function can be useful. The predict function takes in the fitted linear model, as well as the newdata and interval arguments. The newdata is a dataframe that has a column for each of the predictor variables used in the model (the outcome is not required). It will then use the fitted model to predict the outcome (or expected conditional mean) based on the input. The interval parameter is optional, and can be set to either "prediction" or "confidence", in order to automatically compute a prediction or confidence interval around the predicted value. By default, this will be at the \(95\%\) level of confidence, but this can be controlled using the level argument.
When reading the summary output, the table of Coefficients gives the estimated value (Estimate), standard error (Std. Error), \(t\)-test statistic (t value), and the \(p\)-value (Pr(>|t|)). Beneath, the mean-squared error is listed as the Residual standard error, with the relevant number of degrees of freedom specified for the \(t\)-distribution. The \(R^2\) is given as Multiple R-squared beneath that. The output from the predict function is a matrix, with a column of the predicted point estimated (fit), followed by the lower and upper bounds on the interval (lwr and upr, respectively).
Self-Assessment
Note: the following questions are still experimental. Please contact me if you have any issues with these components. This can be if there are incorrect answers, or if there are any technical concerns. Each question currently has an ID with it, randomized for each version. If you have issues, reporting the specific ID will allow for easier checking!
For each question, you can check your answer using the checkmark button. You can cycle through variants of the question by pressing the arrow icon.
Information on an outcome and predictor are collected, with the goal of regressing the outcome on the predictor.
In the sample of 95 observations, the mean of the predictor was -5.95, with a standard deviation of 3.16. Further, the mean of the outcome was -10.11, with a standard deviation of 4.08. The covariance between the two was 8.12.
- What is the estimated value of the intercept in the least squares regression line?
- What is the estimated value of the slope in the least squares regression line?
- What is the predicted value of the outcome, if the predictor takes a value of -12.72?
- What is the predicted change in the outcome, if the predictor is increased by 5?
- What is the total sum of squares?
- If the sum of squared errors is 940.24, what is the regression sum of squares?
- If the sum of squared errors is 940.24, what is the coefficient of determination?
- If the sum of squared errors is 940.24, what is the mean squared error?
(Question ID: 0783212833)
Information on an outcome and predictor are collected, with the goal of regressing the outcome on the predictor.
In the sample of 77 observations, the mean of the predictor was 6.85, with a standard deviation of 10.3. Further, the mean of the outcome was 2.42, with a standard deviation of 1.12. The covariance between the two was 10.2.
- What is the estimated value of the intercept in the least squares regression line?
- What is the estimated value of the slope in the least squares regression line?
- What is the predicted value of the outcome, if the predictor takes a value of -18.75?
- What is the predicted change in the outcome, if the predictor is increased by 7?
- What is the total sum of squares?
- If the regression sum of squares is 74.99, what is the sum of squared errors?
- If the regression sum of squares is 74.99, what is the coefficient of determination?
- If the regression sum of squares is 74.99, what is the estimated conditional variance?
(Question ID: 0265227136)
Information on an outcome and predictor are collected, with the goal of regressing the outcome on the predictor.
In the sample of 80 observations, the mean of the predictor was 8.53, with a standard deviation of 1.86. Further, the mean of the outcome was -18.31, with a standard deviation of 9.76. The covariance between the two was -8.64.
- What is the estimated value of the intercept in the least squares regression line?
- What is the estimated value of the slope in the least squares regression line?
- What is the predicted value of the outcome, if the predictor takes a value of 11.92?
- What is the predicted change in the outcome, if the predictor is increased by 2?
- What is the total sum of squares?
- If the regression sum of squares is 1694.13, what is the sum of squared errors?
- If the regression sum of squares is 1694.13, what is the coefficient of determination?
- If the regression sum of squares is 1694.13, what is the estimated residual variance?
(Question ID: 0460020326)
Information on an outcome and predictor are collected, with the goal of regressing the outcome on the predictor.
In the sample of 91 observations, the mean of the predictor was -0.58, with a standard deviation of 4.9. Further, the mean of the outcome was -1.51, with a standard deviation of 29.94. The covariance between the two was -39.31.
- What is the estimated value of the intercept in the least squares regression line?
- What is the estimated value of the slope in the least squares regression line?
- What is the predicted value of the outcome, if the predictor takes a value of 6.22?
- What is the predicted change in the outcome, if the predictor is decreased by 6?
- What is the total sum of squares?
- If the sum of squared errors is 74891.32, what is the regression sum of squares?
- If the sum of squared errors is 74891.32, what is the \(R^2\) value?
- If the sum of squared errors is 74891.32, what is the estimated conditional variance?
(Question ID: 0227274256)
Information on an outcome and predictor are collected, with the goal of regressing the outcome on the predictor.
In the sample of 45 observations, the mean of the predictor was -7.96, with a standard deviation of 6.36. Further, the mean of the outcome was -16.81, with a standard deviation of 73.3. The covariance between the two was 73.88.
- What is the estimated value of the intercept in the least squares regression line?
- What is the estimated value of the slope in the least squares regression line?
- What is the predicted value of the outcome, if the predictor takes a value of 0.98?
- What is the predicted change in the outcome, if the predictor is increased by 6?
- What is the total sum of squares?
- If the sum of squared errors is 230498.8, what is the regression sum of squares?
- If the sum of squared errors is 230498.8, what is the \(R^2\) value?
- If the sum of squared errors is 230498.8, what is the estimated conditional variance?
(Question ID: 0933989122)
Information on an outcome and predictor are collected, with the goal of regressing the outcome on the predictor.
In the sample of 65 observations, the mean of the predictor was 10.72, with a standard deviation of 7.24. Further, the mean of the outcome was -8.49, with a standard deviation of 8.48. The covariance between the two was -49.88.
- What is the estimated value of the intercept in the least squares regression line?
- What is the estimated value of the slope in the least squares regression line?
- What is the predicted value of the outcome, if the predictor takes a value of 19.07?
- What is the predicted change in the outcome, if the predictor is increased by 21?
- What is the total sum of squares?
- If the sum of squared errors is 1566.59, what is the regression sum of squares?
- If the sum of squared errors is 1566.59, what is the \(R^2\) value?
- If the sum of squared errors is 1566.59, what is the mean squared error?
(Question ID: 0920114151)
Information on an outcome and predictor are collected, with the goal of regressing the outcome on the predictor.
In the sample of 62 observations, the mean of the predictor was -3.13, with a standard deviation of 2.02. Further, the mean of the outcome was 1, with a standard deviation of 2.06. The covariance between the two was 2.77.
- What is the estimated value of the intercept in the least squares regression line?
- What is the estimated value of the slope in the least squares regression line?
- What is the predicted value of the outcome, if the predictor takes a value of -0.75?
- What is the predicted change in the outcome, if the predictor is decreased by 1?
- What is the total sum of squares?
- If the sum of squared errors is 145.31, what is the regression sum of squares?
- If the sum of squared errors is 145.31, what is the coefficient of determination?
- If the sum of squared errors is 145.31, what is the estimated conditional variance?
(Question ID: 0968165588)
Information on an outcome and predictor are collected, with the goal of regressing the outcome on the predictor.
In the sample of 97 observations, the mean of the predictor was -7.59, with a standard deviation of 0.91. Further, the mean of the outcome was 20.07, with a standard deviation of 5.73. The covariance between the two was -1.95.
- What is the estimated value of the intercept in the least squares regression line?
- What is the estimated value of the slope in the least squares regression line?
- What is the predicted value of the outcome, if the predictor takes a value of -7.4?
- What is the predicted change in the outcome, if the predictor is decreased by 2?
- What is the total sum of squares?
- If the regression sum of squares is 433.56, what is the sum of squared errors?
- If the regression sum of squares is 433.56, what is the coefficient of determination?
- If the regression sum of squares is 433.56, what is the mean squared error?
(Question ID: 0016816512)
Information on an outcome and predictor are collected, with the goal of regressing the outcome on the predictor.
In the sample of 71 observations, the mean of the predictor was 2.99, with a standard deviation of 3.71. Further, the mean of the outcome was 0.65, with a standard deviation of 2.88. The covariance between the two was -8.33.
- What is the estimated value of the intercept in the least squares regression line?
- What is the estimated value of the slope in the least squares regression line?
- What is the predicted value of the outcome, if the predictor takes a value of 4.03?
- What is the predicted change in the outcome, if the predictor is increased by 8?
- What is the total sum of squares?
- If the sum of squared errors is 228.01, what is the regression sum of squares?
- If the sum of squared errors is 228.01, what is the \(R^2\) value?
- If the sum of squared errors is 228.01, what is the estimated conditional variance?
(Question ID: 0569265192)
Information on an outcome and predictor are collected, with the goal of regressing the outcome on the predictor.
In the sample of 63 observations, the mean of the predictor was 0.99, with a standard deviation of 6.32. Further, the mean of the outcome was 11.48, with a standard deviation of 68.46. The covariance between the two was -88.44.
- What is the estimated value of the intercept in the least squares regression line?
- What is the estimated value of the slope in the least squares regression line?
- What is the predicted value of the outcome, if the predictor takes a value of 5.72?
- What is the predicted change in the outcome, if the predictor is decreased by 12?
- What is the total sum of squares?
- If the sum of squared errors is 278413.7, what is the regression sum of squares?
- If the sum of squared errors is 278413.7, what is the coefficient of determination?
- If the sum of squared errors is 278413.7, what is the estimated conditional variance?
(Question ID: 0641121557)
Information on an outcome and predictor are collected, with the goal of regressing the outcome on the predictor.
In the sample of 38 observations, the mean of the predictor was 6.2, with a standard deviation of 5.36. Further, the mean of the outcome was 1.02, with a standard deviation of 9.83. The covariance between the two was -17.4.
- What is the estimated value of the intercept in the least squares regression line?
- What is the estimated value of the slope in the least squares regression line?
- What is the predicted value of the outcome, if the predictor takes a value of -1.84?
- What is the predicted change in the outcome, if the predictor is increased by 6?
- What is the total sum of squares?
- If the regression sum of squares is 392.44, what is the sum of squared errors?
- If the regression sum of squares is 392.44, what is the \(R^2\) value?
- If the regression sum of squares is 392.44, what is the estimated residual variance?
(Question ID: 0677636226)
Information on an outcome and predictor are collected, with the goal of regressing the outcome on the predictor.
In the sample of 68 observations, the mean of the predictor was 8.55, with a standard deviation of 1.17. Further, the mean of the outcome was -36.73, with a standard deviation of 22.19. The covariance between the two was -9.72.
- What is the estimated value of the intercept in the least squares regression line?
- What is the estimated value of the slope in the least squares regression line?
- What is the predicted value of the outcome, if the predictor takes a value of 7.87?
- What is the predicted change in the outcome, if the predictor is increased by 2?
- What is the total sum of squares?
- If the regression sum of squares is 4599.83, what is the sum of squared errors?
- If the regression sum of squares is 4599.83, what is the coefficient of determination?
- If the regression sum of squares is 4599.83, what is the mean squared error?
(Question ID: 0619058890)
Information on an outcome and predictor are collected, with the goal of regressing the outcome on the predictor.
In the sample of 55 observations, the mean of the predictor was -0.5, with a standard deviation of 4.22. Further, the mean of the outcome was 2.95, with a standard deviation of 2.91. The covariance between the two was 11.32.
- What is the estimated value of the intercept in the least squares regression line?
- What is the estimated value of the slope in the least squares regression line?
- What is the predicted value of the outcome, if the predictor takes a value of 3.8?
- What is the predicted change in the outcome, if the predictor is increased by 3?
- What is the total sum of squares?
- If the regression sum of squares is 389.96, what is the sum of squared errors?
- If the regression sum of squares is 389.96, what is the coefficient of determination?
- If the regression sum of squares is 389.96, what is the estimated residual variance?
(Question ID: 0342388810)
Information on an outcome and predictor are collected, with the goal of regressing the outcome on the predictor.
In the sample of 30 observations, the mean of the predictor was 9.81, with a standard deviation of 1.24. Further, the mean of the outcome was -10.09, with a standard deviation of 1.77. The covariance between the two was -1.36.
- What is the estimated value of the intercept in the least squares regression line?
- What is the estimated value of the slope in the least squares regression line?
- What is the predicted value of the outcome, if the predictor takes a value of 9.65?
- What is the predicted change in the outcome, if the predictor is decreased by 2?
- What is the total sum of squares?
- If the regression sum of squares is 34.75, what is the sum of squared errors?
- If the regression sum of squares is 34.75, what is the coefficient of determination?
- If the regression sum of squares is 34.75, what is the estimated conditional variance?
(Question ID: 0848004220)
Information on an outcome and predictor are collected, with the goal of regressing the outcome on the predictor.
In the sample of 50 observations, the mean of the predictor was 6.84, with a standard deviation of 10.04. Further, the mean of the outcome was -28.2, with a standard deviation of 284.99. The covariance between the two was -952.3.
- What is the estimated value of the intercept in the least squares regression line?
- What is the estimated value of the slope in the least squares regression line?
- What is the predicted value of the outcome, if the predictor takes a value of -7.01?
- What is the predicted change in the outcome, if the predictor is increased by 19?
- What is the total sum of squares?
- If the regression sum of squares is 440922.2, what is the sum of squared errors?
- If the regression sum of squares is 440922.2, what is the coefficient of determination?
- If the regression sum of squares is 440922.2, what is the estimated residual variance?
(Question ID: 0312590408)
Information on an outcome and predictor are collected, with the goal of regressing the outcome on the predictor.
In the sample of 44 observations, the mean of the predictor was 3.97, with a standard deviation of 1.09. Further, the mean of the outcome was 5.27, with a standard deviation of 28.27. The covariance between the two was 2.46.
- What is the estimated value of the intercept in the least squares regression line?
- What is the estimated value of the slope in the least squares regression line?
- What is the predicted value of the outcome, if the predictor takes a value of 5.78?
- What is the predicted change in the outcome, if the predictor is decreased by 6?
- What is the total sum of squares?
- If the regression sum of squares is 213.97, what is the sum of squared errors?
- If the regression sum of squares is 213.97, what is the coefficient of determination?
- If the regression sum of squares is 213.97, what is the mean squared error?
(Question ID: 0937038533)
Information on an outcome and predictor are collected, with the goal of regressing the outcome on the predictor.
In the sample of 71 observations, the mean of the predictor was -5.75, with a standard deviation of 7.1. Further, the mean of the outcome was -30.95, with a standard deviation of 176.78. The covariance between the two was 176.74.
- What is the estimated value of the intercept in the least squares regression line?
- What is the estimated value of the slope in the least squares regression line?
- What is the predicted value of the outcome, if the predictor takes a value of -20.97?
- What is the predicted change in the outcome, if the predictor is decreased by 25?
- What is the total sum of squares?
- If the regression sum of squares is 43269.43, what is the sum of squared errors?
- If the regression sum of squares is 43269.43, what is the coefficient of determination?
- If the regression sum of squares is 43269.43, what is the mean squared error?
(Question ID: 0121326554)
Information on an outcome and predictor are collected, with the goal of regressing the outcome on the predictor.
In the sample of 76 observations, the mean of the predictor was 4.66, with a standard deviation of 7.24. Further, the mean of the outcome was -4.46, with a standard deviation of 19.24. The covariance between the two was -50.82.
- What is the estimated value of the intercept in the least squares regression line?
- What is the estimated value of the slope in the least squares regression line?
- What is the predicted value of the outcome, if the predictor takes a value of 16.93?
- What is the predicted change in the outcome, if the predictor is decreased by 31?
- What is the total sum of squares?
- If the regression sum of squares is 3696.92, what is the sum of squared errors?
- If the regression sum of squares is 3696.92, what is the \(R^2\) value?
- If the regression sum of squares is 3696.92, what is the estimated residual variance?
(Question ID: 0546514895)
Information on an outcome and predictor are collected, with the goal of regressing the outcome on the predictor.
In the sample of 89 observations, the mean of the predictor was 4.33, with a standard deviation of 4.51. Further, the mean of the outcome was -1.98, with a standard deviation of 73.6. The covariance between the two was -33.73.
- What is the estimated value of the intercept in the least squares regression line?
- What is the estimated value of the slope in the least squares regression line?
- What is the predicted value of the outcome, if the predictor takes a value of 5.26?
- What is the predicted change in the outcome, if the predictor is increased by 11?
- What is the total sum of squares?
- If the regression sum of squares is 4989.19, what is the sum of squared errors?
- If the regression sum of squares is 4989.19, what is the coefficient of determination?
- If the regression sum of squares is 4989.19, what is the estimated residual variance?
(Question ID: 0985637321)
Information on an outcome and predictor are collected, with the goal of regressing the outcome on the predictor.
In the sample of 64 observations, the mean of the predictor was -9.81, with a standard deviation of 7.02. Further, the mean of the outcome was 44.77, with a standard deviation of 192.85. The covariance between the two was -146.38.
- What is the estimated value of the intercept in the least squares regression line?
- What is the estimated value of the slope in the least squares regression line?
- What is the predicted value of the outcome, if the predictor takes a value of -15.5?
- What is the predicted change in the outcome, if the predictor is decreased by 34?
- What is the total sum of squares?
- If the sum of squared errors is 2315642, what is the regression sum of squares?
- If the sum of squared errors is 2315642, what is the \(R^2\) value?
- If the sum of squared errors is 2315642, what is the estimated conditional variance?
(Question ID: 0018775288)
Information on an outcome and predictor are collected, with the goal of regressing the outcome on the predictor.
In the sample of 84 observations, the mean of the predictor was 4.36, with a standard deviation of 4.1. Further, the mean of the outcome was -8.78, with a standard deviation of 18.98. The covariance between the two was -41.94.
- What is the estimated value of the intercept in the least squares regression line?
- What is the estimated value of the slope in the least squares regression line?
- What is the predicted value of the outcome, if the predictor takes a value of 10.47?
- What is the predicted change in the outcome, if the predictor is increased by 9?
- What is the total sum of squares?
- If the sum of squared errors is 21239.51, what is the regression sum of squares?
- If the sum of squared errors is 21239.51, what is the \(R^2\) value?
- If the sum of squared errors is 21239.51, what is the mean squared error?
(Question ID: 0088380315)
Information on an outcome and predictor are collected, with the goal of regressing the outcome on the predictor.
In the sample of 46 observations, the mean of the predictor was 9.42, with a standard deviation of 4.7. Further, the mean of the outcome was 34.66, with a standard deviation of 140.97. The covariance between the two was 75.68.
- What is the estimated value of the intercept in the least squares regression line?
- What is the estimated value of the slope in the least squares regression line?
- What is the predicted value of the outcome, if the predictor takes a value of 15.5?
- What is the predicted change in the outcome, if the predictor is decreased by 1?
- What is the total sum of squares?
- If the regression sum of squares is 11617.13, what is the sum of squared errors?
- If the regression sum of squares is 11617.13, what is the coefficient of determination?
- If the regression sum of squares is 11617.13, what is the mean squared error?
(Question ID: 0149611908)
Information on an outcome and predictor are collected, with the goal of regressing the outcome on the predictor.
In the sample of 45 observations, the mean of the predictor was -6.06, with a standard deviation of 7.39. Further, the mean of the outcome was -4.52, with a standard deviation of 72.03. The covariance between the two was 260.44.
- What is the estimated value of the intercept in the least squares regression line?
- What is the estimated value of the slope in the least squares regression line?
- What is the predicted value of the outcome, if the predictor takes a value of -12.12?
- What is the predicted change in the outcome, if the predictor is decreased by 13?
- What is the total sum of squares?
- If the regression sum of squares is 54615.03, what is the sum of squared errors?
- If the regression sum of squares is 54615.03, what is the coefficient of determination?
- If the regression sum of squares is 54615.03, what is the mean squared error?
(Question ID: 0272629368)
Information on an outcome and predictor are collected, with the goal of regressing the outcome on the predictor.
In the sample of 42 observations, the mean of the predictor was -6.81, with a standard deviation of 5.43. Further, the mean of the outcome was -22.89, with a standard deviation of 119.25. The covariance between the two was 72.74.
- What is the estimated value of the intercept in the least squares regression line?
- What is the estimated value of the slope in the least squares regression line?
- What is the predicted value of the outcome, if the predictor takes a value of -10.38?
- What is the predicted change in the outcome, if the predictor is increased by 7?
- What is the total sum of squares?
- If the regression sum of squares is 7355.71, what is the sum of squared errors?
- If the regression sum of squares is 7355.71, what is the coefficient of determination?
- If the regression sum of squares is 7355.71, what is the estimated residual variance?
(Question ID: 0035277371)
Information on an outcome and predictor are collected, with the goal of regressing the outcome on the predictor.
In the sample of 68 observations, the mean of the predictor was -2.6, with a standard deviation of 3.91. Further, the mean of the outcome was 3.68, with a standard deviation of 59.33. The covariance between the two was -54.68.
- What is the estimated value of the intercept in the least squares regression line?
- What is the estimated value of the slope in the least squares regression line?
- What is the predicted value of the outcome, if the predictor takes a value of -0.27?
- What is the predicted change in the outcome, if the predictor is increased by 17?
- What is the total sum of squares?
- If the regression sum of squares is 13109.87, what is the sum of squared errors?
- If the regression sum of squares is 13109.87, what is the \(R^2\) value?
- If the regression sum of squares is 13109.87, what is the mean squared error?
(Question ID: 0216081161)
Information on an outcome and predictor are collected, with the goal of regressing the outcome on the predictor.
In the sample of 84 observations, the mean of the predictor was -4.37, with a standard deviation of 4.87. Further, the mean of the outcome was -22.75, with a standard deviation of 182.25. The covariance between the two was 216.46.
- What is the estimated value of the intercept in the least squares regression line?
- What is the estimated value of the slope in the least squares regression line?
- What is the predicted value of the outcome, if the predictor takes a value of -3.98?
- What is the predicted change in the outcome, if the predictor is increased by 7?
- What is the total sum of squares?
- If the sum of squared errors is 2593200, what is the regression sum of squares?
- If the sum of squared errors is 2593200, what is the coefficient of determination?
- If the sum of squared errors is 2593200, what is the estimated conditional variance?
(Question ID: 0084616907)
Information on an outcome and predictor are collected, with the goal of regressing the outcome on the predictor.
In the sample of 70 observations, the mean of the predictor was 6.08, with a standard deviation of 0.88. Further, the mean of the outcome was -22.16, with a standard deviation of 27.24. The covariance between the two was -4.9.
- What is the estimated value of the intercept in the least squares regression line?
- What is the estimated value of the slope in the least squares regression line?
- What is the predicted value of the outcome, if the predictor takes a value of 6.48?
- What is the predicted change in the outcome, if the predictor is increased by 3?
- What is the total sum of squares?
- If the sum of squared errors is 49030.31, what is the regression sum of squares?
- If the sum of squared errors is 49030.31, what is the coefficient of determination?
- If the sum of squared errors is 49030.31, what is the mean squared error?
(Question ID: 0222871768)
Information on an outcome and predictor are collected, with the goal of regressing the outcome on the predictor.
In the sample of 36 observations, the mean of the predictor was -9.26, with a standard deviation of 6.43. Further, the mean of the outcome was 27.62, with a standard deviation of 31.26. The covariance between the two was -123.75.
- What is the estimated value of the intercept in the least squares regression line?
- What is the estimated value of the slope in the least squares regression line?
- What is the predicted value of the outcome, if the predictor takes a value of 1.49?
- What is the predicted change in the outcome, if the predictor is increased by 5?
- What is the total sum of squares?
- If the regression sum of squares is 12966.91, what is the sum of squared errors?
- If the regression sum of squares is 12966.91, what is the \(R^2\) value?
- If the regression sum of squares is 12966.91, what is the estimated conditional variance?
(Question ID: 0618279346)
Information on an outcome and predictor are collected, with the goal of regressing the outcome on the predictor.
In the sample of 100 observations, the mean of the predictor was 4.81, with a standard deviation of 10.19. Further, the mean of the outcome was 15.3, with a standard deviation of 66.49. The covariance between the two was 285.57.
- What is the estimated value of the intercept in the least squares regression line?
- What is the estimated value of the slope in the least squares regression line?
- What is the predicted value of the outcome, if the predictor takes a value of -13.44?
- What is the predicted change in the outcome, if the predictor is increased by 33?
- What is the total sum of squares?
- If the regression sum of squares is 77744.63, what is the sum of squared errors?
- If the regression sum of squares is 77744.63, what is the coefficient of determination?
- If the regression sum of squares is 77744.63, what is the mean squared error?
(Question ID: 0569114534)
Information on an outcome and predictor are collected, with the goal of regressing the outcome on the predictor.
In the sample of 71 observations, the mean of the predictor was 4.49, with a standard deviation of 11.29. Further, the mean of the outcome was -1.75, with a standard deviation of 2.59. The covariance between the two was 26.67.
- What is the estimated value of the intercept in the least squares regression line?
- What is the estimated value of the slope in the least squares regression line?
- What is the predicted value of the outcome, if the predictor takes a value of 14.93?
- What is the predicted change in the outcome, if the predictor is increased by 26?
- What is the total sum of squares?
- If the regression sum of squares is 390.38, what is the sum of squared errors?
- If the regression sum of squares is 390.38, what is the coefficient of determination?
- If the regression sum of squares is 390.38, what is the estimated residual variance?
(Question ID: 0684702067)
Information on an outcome and predictor are collected, with the goal of regressing the outcome on the predictor.
In the sample of 97 observations, the mean of the predictor was 0.26, with a standard deviation of 2.47. Further, the mean of the outcome was 3.19, with a standard deviation of 33.4. The covariance between the two was 35.64.
- What is the estimated value of the intercept in the least squares regression line?
- What is the estimated value of the slope in the least squares regression line?
- What is the predicted value of the outcome, if the predictor takes a value of 0.63?
- What is the predicted change in the outcome, if the predictor is decreased by 2?
- What is the total sum of squares?
- If the sum of squared errors is 87050.71, what is the regression sum of squares?
- If the sum of squared errors is 87050.71, what is the coefficient of determination?
- If the sum of squared errors is 87050.71, what is the mean squared error?
(Question ID: 0690387214)
Information on an outcome and predictor are collected, with the goal of regressing the outcome on the predictor.
In the sample of 45 observations, the mean of the predictor was -9.8, with a standard deviation of 9.62. Further, the mean of the outcome was -42.09, with a standard deviation of 260.08. The covariance between the two was -254.85.
- What is the estimated value of the intercept in the least squares regression line?
- What is the estimated value of the slope in the least squares regression line?
- What is the predicted value of the outcome, if the predictor takes a value of -7.45?
- What is the predicted change in the outcome, if the predictor is decreased by 47?
- What is the total sum of squares?
- If the sum of squared errors is 2945305, what is the regression sum of squares?
- If the sum of squared errors is 2945305, what is the coefficient of determination?
- If the sum of squared errors is 2945305, what is the mean squared error?
(Question ID: 0537851626)
Information on an outcome and predictor are collected, with the goal of regressing the outcome on the predictor.
In the sample of 53 observations, the mean of the predictor was -4.84, with a standard deviation of 9.39. Further, the mean of the outcome was 3.56, with a standard deviation of 24.3. The covariance between the two was -143.55.
- What is the estimated value of the intercept in the least squares regression line?
- What is the estimated value of the slope in the least squares regression line?
- What is the predicted value of the outcome, if the predictor takes a value of -11.75?
- What is the predicted change in the outcome, if the predictor is decreased by 39?
- What is the total sum of squares?
- If the sum of squared errors is 18539.37, what is the regression sum of squares?
- If the sum of squared errors is 18539.37, what is the coefficient of determination?
- If the sum of squared errors is 18539.37, what is the estimated conditional variance?
(Question ID: 0669905960)
Information on an outcome and predictor are collected, with the goal of regressing the outcome on the predictor.
In the sample of 69 observations, the mean of the predictor was -6.67, with a standard deviation of 3.15. Further, the mean of the outcome was -9.07, with a standard deviation of 12.22. The covariance between the two was 24.35.
- What is the estimated value of the intercept in the least squares regression line?
- What is the estimated value of the slope in the least squares regression line?
- What is the predicted value of the outcome, if the predictor takes a value of -9.16?
- What is the predicted change in the outcome, if the predictor is increased by 14?
- What is the total sum of squares?
- If the regression sum of squares is 4069.65, what is the sum of squared errors?
- If the regression sum of squares is 4069.65, what is the coefficient of determination?
- If the regression sum of squares is 4069.65, what is the mean squared error?
(Question ID: 0785799397)
Information on an outcome and predictor are collected, with the goal of regressing the outcome on the predictor.
In the sample of 52 observations, the mean of the predictor was 0.74, with a standard deviation of 4.61. Further, the mean of the outcome was 8.01, with a standard deviation of 65.7. The covariance between the two was 76.93.
- What is the estimated value of the intercept in the least squares regression line?
- What is the estimated value of the slope in the least squares regression line?
- What is the predicted value of the outcome, if the predictor takes a value of 7.68?
- What is the predicted change in the outcome, if the predictor is decreased by 17?
- What is the total sum of squares?
- If the regression sum of squares is 14186.7, what is the sum of squared errors?
- If the regression sum of squares is 14186.7, what is the \(R^2\) value?
- If the regression sum of squares is 14186.7, what is the estimated residual variance?
(Question ID: 0470693415)
Information on an outcome and predictor are collected, with the goal of regressing the outcome on the predictor.
In the sample of 39 observations, the mean of the predictor was -6.09, with a standard deviation of 2.89. Further, the mean of the outcome was 28.77, with a standard deviation of 32.13. The covariance between the two was -12.26.
- What is the estimated value of the intercept in the least squares regression line?
- What is the estimated value of the slope in the least squares regression line?
- What is the predicted value of the outcome, if the predictor takes a value of -0.92?
- What is the predicted change in the outcome, if the predictor is increased by 13?
- What is the total sum of squares?
- If the regression sum of squares is 695.91, what is the sum of squared errors?
- If the regression sum of squares is 695.91, what is the coefficient of determination?
- If the regression sum of squares is 695.91, what is the estimated conditional variance?
(Question ID: 0365276836)
Information on an outcome and predictor are collected, with the goal of regressing the outcome on the predictor.
In the sample of 75 observations, the mean of the predictor was 2.38, with a standard deviation of 1.04. Further, the mean of the outcome was -1.48, with a standard deviation of 4.33. The covariance between the two was -2.96.
- What is the estimated value of the intercept in the least squares regression line?
- What is the estimated value of the slope in the least squares regression line?
- What is the predicted value of the outcome, if the predictor takes a value of 0.67?
- What is the predicted change in the outcome, if the predictor is decreased by 4?
- What is the total sum of squares?
- If the sum of squared errors is 791.73, what is the regression sum of squares?
- If the sum of squared errors is 791.73, what is the \(R^2\) value?
- If the sum of squared errors is 791.73, what is the mean squared error?
(Question ID: 0642496063)
Information on an outcome and predictor are collected, with the goal of regressing the outcome on the predictor.
In the sample of 63 observations, the mean of the predictor was -0.67, with a standard deviation of 8.61. Further, the mean of the outcome was -4.86, with a standard deviation of 0.59. The covariance between the two was 3.53.
- What is the estimated value of the intercept in the least squares regression line?
- What is the estimated value of the slope in the least squares regression line?
- What is the predicted value of the outcome, if the predictor takes a value of -2.33?
- What is the predicted change in the outcome, if the predictor is decreased by 36?
- What is the total sum of squares?
- If the regression sum of squares is 10.55, what is the sum of squared errors?
- If the regression sum of squares is 10.55, what is the \(R^2\) value?
- If the regression sum of squares is 10.55, what is the estimated conditional variance?
(Question ID: 0977196866)
Information on an outcome and predictor are collected, with the goal of regressing the outcome on the predictor.
In the sample of 73 observations, the mean of the predictor was -1.72, with a standard deviation of 9.96. Further, the mean of the outcome was 0.84, with a standard deviation of 144.6. The covariance between the two was 200.99.
- What is the estimated value of the intercept in the least squares regression line?
- What is the estimated value of the slope in the least squares regression line?
- What is the predicted value of the outcome, if the predictor takes a value of -18.81?
- What is the predicted change in the outcome, if the predictor is decreased by 8?
- What is the total sum of squares?
- If the sum of squared errors is 1476093, what is the regression sum of squares?
- If the sum of squared errors is 1476093, what is the coefficient of determination?
- If the sum of squared errors is 1476093, what is the estimated residual variance?
(Question ID: 0766293879)
Information on an outcome and predictor are collected, with the goal of regressing the outcome on the predictor.
In the sample of 75 observations, the mean of the predictor was 0.65, with a standard deviation of 5.31. Further, the mean of the outcome was 16.42, with a standard deviation of 140.93. The covariance between the two was 280.94.
- What is the estimated value of the intercept in the least squares regression line?
- What is the estimated value of the slope in the least squares regression line?
- What is the predicted value of the outcome, if the predictor takes a value of 4.42?
- What is the predicted change in the outcome, if the predictor is decreased by 15?
- What is the total sum of squares?
- If the regression sum of squares is 206868.9, what is the sum of squared errors?
- If the regression sum of squares is 206868.9, what is the coefficient of determination?
- If the regression sum of squares is 206868.9, what is the estimated conditional variance?
(Question ID: 0221877693)
Information on an outcome and predictor are collected, with the goal of regressing the outcome on the predictor.
In the sample of 100 observations, the mean of the predictor was -3.01, with a standard deviation of 10.42. Further, the mean of the outcome was 11.18, with a standard deviation of 187.6. The covariance between the two was -526.48.
- What is the estimated value of the intercept in the least squares regression line?
- What is the estimated value of the slope in the least squares regression line?
- What is the predicted value of the outcome, if the predictor takes a value of -17.25?
- What is the predicted change in the outcome, if the predictor is increased by 52?
- What is the total sum of squares?
- If the regression sum of squares is 252730.8, what is the sum of squared errors?
- If the regression sum of squares is 252730.8, what is the coefficient of determination?
- If the regression sum of squares is 252730.8, what is the estimated residual variance?
(Question ID: 0201495545)
Information on an outcome and predictor are collected, with the goal of regressing the outcome on the predictor.
In the sample of 44 observations, the mean of the predictor was -4.98, with a standard deviation of 6.53. Further, the mean of the outcome was 1.05, with a standard deviation of 5.11. The covariance between the two was -17.01.
- What is the estimated value of the intercept in the least squares regression line?
- What is the estimated value of the slope in the least squares regression line?
- What is the predicted value of the outcome, if the predictor takes a value of -12.78?
- What is the predicted change in the outcome, if the predictor is increased by 27?
- What is the total sum of squares?
- If the regression sum of squares is 292.63, what is the sum of squared errors?
- If the regression sum of squares is 292.63, what is the coefficient of determination?
- If the regression sum of squares is 292.63, what is the estimated residual variance?
(Question ID: 0094263898)
Information on an outcome and predictor are collected, with the goal of regressing the outcome on the predictor.
In the sample of 60 observations, the mean of the predictor was 1.11, with a standard deviation of 6.46. Further, the mean of the outcome was 2.63, with a standard deviation of 28.15. The covariance between the two was -67.2.
- What is the estimated value of the intercept in the least squares regression line?
- What is the estimated value of the slope in the least squares regression line?
- What is the predicted value of the outcome, if the predictor takes a value of 4.48?
- What is the predicted change in the outcome, if the predictor is increased by 22?
- What is the total sum of squares?
- If the regression sum of squares is 6362.83, what is the sum of squared errors?
- If the regression sum of squares is 6362.83, what is the \(R^2\) value?
- If the regression sum of squares is 6362.83, what is the estimated residual variance?
(Question ID: 0963181787)
Information on an outcome and predictor are collected, with the goal of regressing the outcome on the predictor.
In the sample of 38 observations, the mean of the predictor was -1.41, with a standard deviation of 6.71. Further, the mean of the outcome was 0.18, with a standard deviation of 73.45. The covariance between the two was -105.29.
- What is the estimated value of the intercept in the least squares regression line?
- What is the estimated value of the slope in the least squares regression line?
- What is the predicted value of the outcome, if the predictor takes a value of -8.19?
- What is the predicted change in the outcome, if the predictor is decreased by 24?
- What is the total sum of squares?
- If the sum of squared errors is 190501.8, what is the regression sum of squares?
- If the sum of squared errors is 190501.8, what is the \(R^2\) value?
- If the sum of squared errors is 190501.8, what is the estimated conditional variance?
(Question ID: 0859554246)
Information on an outcome and predictor are collected, with the goal of regressing the outcome on the predictor.
In the sample of 98 observations, the mean of the predictor was -1.38, with a standard deviation of 8.78. Further, the mean of the outcome was 2.06, with a standard deviation of 115.61. The covariance between the two was -235.
- What is the estimated value of the intercept in the least squares regression line?
- What is the estimated value of the slope in the least squares regression line?
- What is the predicted value of the outcome, if the predictor takes a value of 3.9?
- What is the predicted change in the outcome, if the predictor is decreased by 27?
- What is the total sum of squares?
- If the sum of squared errors is 1227014, what is the regression sum of squares?
- If the sum of squared errors is 1227014, what is the \(R^2\) value?
- If the sum of squared errors is 1227014, what is the estimated residual variance?
(Question ID: 0112309209)
Information on an outcome and predictor are collected, with the goal of regressing the outcome on the predictor.
In the sample of 94 observations, the mean of the predictor was -8.86, with a standard deviation of 5.67. Further, the mean of the outcome was -25.76, with a standard deviation of 77.71. The covariance between the two was 113.71.
- What is the estimated value of the intercept in the least squares regression line?
- What is the estimated value of the slope in the least squares regression line?
- What is the predicted value of the outcome, if the predictor takes a value of -18.32?
- What is the predicted change in the outcome, if the predictor is increased by 8?
- What is the total sum of squares?
- If the regression sum of squares is 37520.62, what is the sum of squared errors?
- If the regression sum of squares is 37520.62, what is the \(R^2\) value?
- If the regression sum of squares is 37520.62, what is the estimated residual variance?
(Question ID: 0991511674)
Information on an outcome and predictor are collected, with the goal of regressing the outcome on the predictor.
In the sample of 69 observations, the mean of the predictor was -10.05, with a standard deviation of 8.01. Further, the mean of the outcome was 32.09, with a standard deviation of 96.9. The covariance between the two was -293.17.
- What is the estimated value of the intercept in the least squares regression line?
- What is the estimated value of the slope in the least squares regression line?
- What is the predicted value of the outcome, if the predictor takes a value of -24.78?
- What is the predicted change in the outcome, if the predictor is increased by 8?
- What is the total sum of squares?
- If the sum of squared errors is 547358.3, what is the regression sum of squares?
- If the sum of squared errors is 547358.3, what is the \(R^2\) value?
- If the sum of squared errors is 547358.3, what is the estimated residual variance?
(Question ID: 0383696819)
Information on an outcome and predictor are collected, with the goal of regressing the outcome on the predictor.
In the sample of 67 observations, the mean of the predictor was 0.53, with a standard deviation of 3.98. Further, the mean of the outcome was -0.93, with a standard deviation of 92.43. The covariance between the two was -43.
- What is the estimated value of the intercept in the least squares regression line?
- What is the estimated value of the slope in the least squares regression line?
- What is the predicted value of the outcome, if the predictor takes a value of 9.57?
- What is the predicted change in the outcome, if the predictor is decreased by 5?
- What is the total sum of squares?
- If the regression sum of squares is 7754.01, what is the sum of squared errors?
- If the regression sum of squares is 7754.01, what is the \(R^2\) value?
- If the regression sum of squares is 7754.01, what is the mean squared error?
(Question ID: 0125186691)
Information on an outcome and predictor are collected, with the goal of regressing the outcome on the predictor.
In the sample of 39 observations, the mean of the predictor was -0.85, with a standard deviation of 3.7. Further, the mean of the outcome was 0.59, with a standard deviation of 23.02. The covariance between the two was 0.91.
- What is the estimated value of the intercept in the least squares regression line?
- What is the estimated value of the slope in the least squares regression line?
- What is the predicted value of the outcome, if the predictor takes a value of 2.96?
- What is the predicted change in the outcome, if the predictor is decreased by 5?
- What is the total sum of squares?
- If the regression sum of squares is 2.84, what is the sum of squared errors?
- If the regression sum of squares is 2.84, what is the coefficient of determination?
- If the regression sum of squares is 2.84, what is the estimated conditional variance?
(Question ID: 0111582718)
Information on an outcome and predictor are collected, with the goal of regressing the outcome on the predictor.
In the sample of 58 observations, the mean of the predictor was -4.69, with a standard deviation of 3.92. Further, the mean of the outcome was 6.06, with a standard deviation of 12.18. The covariance between the two was -25.36.
- What is the estimated value of the intercept in the least squares regression line?
- What is the estimated value of the slope in the least squares regression line?
- What is the predicted value of the outcome, if the predictor takes a value of 2.15?
- What is the predicted change in the outcome, if the predictor is decreased by 10?
- What is the total sum of squares?
- If the sum of squared errors is 6067.64, what is the regression sum of squares?
- If the sum of squared errors is 6067.64, what is the coefficient of determination?
- If the sum of squared errors is 6067.64, what is the estimated residual variance?
(Question ID: 0785034032)
Information on an outcome and predictor are collected, with the goal of regressing the outcome on the predictor.
In the sample of 30 observations, the mean of the predictor was 4.16, with a standard deviation of 5.93. Further, the mean of the outcome was -0.04, with a standard deviation of 3.68. The covariance between the two was -18.73.
- What is the estimated value of the intercept in the least squares regression line?
- What is the estimated value of the slope in the least squares regression line?
- What is the predicted value of the outcome, if the predictor takes a value of 18.67?
- What is the predicted change in the outcome, if the predictor is decreased by 20?
- What is the total sum of squares?
- If the regression sum of squares is 288.34, what is the sum of squared errors?
- If the regression sum of squares is 288.34, what is the \(R^2\) value?
- If the regression sum of squares is 288.34, what is the mean squared error?
(Question ID: 0554213696)
Information on an outcome and predictor are collected, with the goal of regressing the outcome on the predictor.
In the sample of 71 observations, the mean of the predictor was 3.6, with a standard deviation of 5.03. Further, the mean of the outcome was 0.87, with a standard deviation of 123.94. The covariance between the two was -6.7.
- What is the estimated value of the intercept in the least squares regression line?
- What is the estimated value of the slope in the least squares regression line?
- What is the predicted value of the outcome, if the predictor takes a value of 9.89?
- What is the predicted change in the outcome, if the predictor is increased by 11?
- What is the total sum of squares?
- If the regression sum of squares is 162.15, what is the sum of squared errors?
- If the regression sum of squares is 162.15, what is the coefficient of determination?
- If the regression sum of squares is 162.15, what is the estimated conditional variance?
(Question ID: 0056757361)
Information on an outcome and predictor are collected, with the goal of regressing the outcome on the predictor.
In the sample of 98 observations, the mean of the predictor was 9.1, with a standard deviation of 4.64. Further, the mean of the outcome was 28.64, with a standard deviation of 92.13. The covariance between the two was 104.4.
- What is the estimated value of the intercept in the least squares regression line?
- What is the estimated value of the slope in the least squares regression line?
- What is the predicted value of the outcome, if the predictor takes a value of 12.48?
- What is the predicted change in the outcome, if the predictor is increased by 4?
- What is the total sum of squares?
- If the sum of squared errors is 774374.7, what is the regression sum of squares?
- If the sum of squared errors is 774374.7, what is the \(R^2\) value?
- If the sum of squared errors is 774374.7, what is the estimated conditional variance?
(Question ID: 0741443301)
Information on an outcome and predictor are collected, with the goal of regressing the outcome on the predictor.
In the sample of 44 observations, the mean of the predictor was 5.83, with a standard deviation of 3.07. Further, the mean of the outcome was 9.08, with a standard deviation of 25.46. The covariance between the two was 41.56.
- What is the estimated value of the intercept in the least squares regression line?
- What is the estimated value of the slope in the least squares regression line?
- What is the predicted value of the outcome, if the predictor takes a value of 7.79?
- What is the predicted change in the outcome, if the predictor is increased by 6?
- What is the total sum of squares?
- If the sum of squared errors is 20003.26, what is the regression sum of squares?
- If the sum of squared errors is 20003.26, what is the \(R^2\) value?
- If the sum of squared errors is 20003.26, what is the estimated residual variance?
(Question ID: 0510387045)
Information on an outcome and predictor are collected, with the goal of regressing the outcome on the predictor.
In the sample of 69 observations, the mean of the predictor was 1.98, with a standard deviation of 8.29. Further, the mean of the outcome was 1.87, with a standard deviation of 23.27. The covariance between the two was 75.63.
- What is the estimated value of the intercept in the least squares regression line?
- What is the estimated value of the slope in the least squares regression line?
- What is the predicted value of the outcome, if the predictor takes a value of 13.45?
- What is the predicted change in the outcome, if the predictor is increased by 23?
- What is the total sum of squares?
- If the regression sum of squares is 5669.5, what is the sum of squared errors?
- If the regression sum of squares is 5669.5, what is the coefficient of determination?
- If the regression sum of squares is 5669.5, what is the estimated conditional variance?
(Question ID: 0942190042)
Information on an outcome and predictor are collected, with the goal of regressing the outcome on the predictor.
In the sample of 89 observations, the mean of the predictor was 1.85, with a standard deviation of 1.98. Further, the mean of the outcome was -10.09, with a standard deviation of 22.46. The covariance between the two was -4.46.
- What is the estimated value of the intercept in the least squares regression line?
- What is the estimated value of the slope in the least squares regression line?
- What is the predicted value of the outcome, if the predictor takes a value of 5.67?
- What is the predicted change in the outcome, if the predictor is increased by 4?
- What is the total sum of squares?
- If the sum of squared errors is 43951.76, what is the regression sum of squares?
- If the sum of squared errors is 43951.76, what is the \(R^2\) value?
- If the sum of squared errors is 43951.76, what is the mean squared error?
(Question ID: 0359772592)
Information on an outcome and predictor are collected, with the goal of regressing the outcome on the predictor.
In the sample of 99 observations, the mean of the predictor was 2.46, with a standard deviation of 8.55. Further, the mean of the outcome was -6.6, with a standard deviation of 99.55. The covariance between the two was 206.85.
- What is the estimated value of the intercept in the least squares regression line?
- What is the estimated value of the slope in the least squares regression line?
- What is the predicted value of the outcome, if the predictor takes a value of -14.7?
- What is the predicted change in the outcome, if the predictor is increased by 23?
- What is the total sum of squares?
- If the sum of squared errors is 913762.7, what is the regression sum of squares?
- If the sum of squared errors is 913762.7, what is the \(R^2\) value?
- If the sum of squared errors is 913762.7, what is the estimated residual variance?
(Question ID: 0238042002)
Information on an outcome and predictor are collected, with the goal of regressing the outcome on the predictor.
In the sample of 60 observations, the mean of the predictor was -10.84, with a standard deviation of 8.61. Further, the mean of the outcome was -8.14, with a standard deviation of 13.95. The covariance between the two was 87.79.
- What is the estimated value of the intercept in the least squares regression line?
- What is the estimated value of the slope in the least squares regression line?
- What is the predicted value of the outcome, if the predictor takes a value of -8.23?
- What is the predicted change in the outcome, if the predictor is increased by 32?
- What is the total sum of squares?
- If the regression sum of squares is 6125.89, what is the sum of squared errors?
- If the regression sum of squares is 6125.89, what is the \(R^2\) value?
- If the regression sum of squares is 6125.89, what is the mean squared error?
(Question ID: 0426445486)
Information on an outcome and predictor are collected, with the goal of regressing the outcome on the predictor.
In the sample of 41 observations, the mean of the predictor was 7.88, with a standard deviation of 6.21. Further, the mean of the outcome was 4.23, with a standard deviation of 130.73. The covariance between the two was -275.61.
- What is the estimated value of the intercept in the least squares regression line?
- What is the estimated value of the slope in the least squares regression line?
- What is the predicted value of the outcome, if the predictor takes a value of 23.05?
- What is the predicted change in the outcome, if the predictor is decreased by 16?
- What is the total sum of squares?
- If the sum of squared errors is 604851.5, what is the regression sum of squares?
- If the sum of squared errors is 604851.5, what is the coefficient of determination?
- If the sum of squared errors is 604851.5, what is the estimated conditional variance?
(Question ID: 0531066376)
Information on an outcome and predictor are collected, with the goal of regressing the outcome on the predictor.
In the sample of 90 observations, the mean of the predictor was -2.43, with a standard deviation of 5.75. Further, the mean of the outcome was 29.73, with a standard deviation of 258.76. The covariance between the two was -85.92.
- What is the estimated value of the intercept in the least squares regression line?
- What is the estimated value of the slope in the least squares regression line?
- What is the predicted value of the outcome, if the predictor takes a value of -10.83?
- What is the predicted change in the outcome, if the predictor is increased by 3?
- What is the total sum of squares?
- If the sum of squared errors is 5939295, what is the regression sum of squares?
- If the sum of squared errors is 5939295, what is the coefficient of determination?
- If the sum of squared errors is 5939295, what is the estimated conditional variance?
(Question ID: 0809595646)
Information on an outcome and predictor are collected, with the goal of regressing the outcome on the predictor.
In the sample of 95 observations, the mean of the predictor was -7.16, with a standard deviation of 10.72. Further, the mean of the outcome was 22.97, with a standard deviation of 62.97. The covariance between the two was -267.83.
- What is the estimated value of the intercept in the least squares regression line?
- What is the estimated value of the slope in the least squares regression line?
- What is the predicted value of the outcome, if the predictor takes a value of -25.48?
- What is the predicted change in the outcome, if the predictor is decreased by 21?
- What is the total sum of squares?
- If the regression sum of squares is 58691.98, what is the sum of squared errors?
- If the regression sum of squares is 58691.98, what is the \(R^2\) value?
- If the regression sum of squares is 58691.98, what is the mean squared error?
(Question ID: 0353086941)
Information on an outcome and predictor are collected, with the goal of regressing the outcome on the predictor.
In the sample of 72 observations, the mean of the predictor was 8.14, with a standard deviation of 7.51. Further, the mean of the outcome was 26.14, with a standard deviation of 44.01. The covariance between the two was 151.69.
- What is the estimated value of the intercept in the least squares regression line?
- What is the estimated value of the slope in the least squares regression line?
- What is the predicted value of the outcome, if the predictor takes a value of 11.41?
- What is the predicted change in the outcome, if the predictor is decreased by 20?
- What is the total sum of squares?
- If the regression sum of squares is 28974.62, what is the sum of squared errors?
- If the regression sum of squares is 28974.62, what is the \(R^2\) value?
- If the regression sum of squares is 28974.62, what is the mean squared error?
(Question ID: 0867721336)
Information on an outcome and predictor are collected, with the goal of regressing the outcome on the predictor.
In the sample of 78 observations, the mean of the predictor was -8.63, with a standard deviation of 10.24. Further, the mean of the outcome was 10.2, with a standard deviation of 22.78. The covariance between the two was -130.72.
- What is the estimated value of the intercept in the least squares regression line?
- What is the estimated value of the slope in the least squares regression line?
- What is the predicted value of the outcome, if the predictor takes a value of -3.49?
- What is the predicted change in the outcome, if the predictor is decreased by 3?
- What is the total sum of squares?
- If the sum of squared errors is 27399.27, what is the regression sum of squares?
- If the sum of squared errors is 27399.27, what is the coefficient of determination?
- If the sum of squared errors is 27399.27, what is the mean squared error?
(Question ID: 0883272131)
Information on an outcome and predictor are collected, with the goal of regressing the outcome on the predictor.
In the sample of 43 observations, the mean of the predictor was 2.21, with a standard deviation of 3.19. Further, the mean of the outcome was -5.76, with a standard deviation of 3.7. The covariance between the two was -10.3.
- What is the estimated value of the intercept in the least squares regression line?
- What is the estimated value of the slope in the least squares regression line?
- What is the predicted value of the outcome, if the predictor takes a value of -3.38?
- What is the predicted change in the outcome, if the predictor is decreased by 6?
- What is the total sum of squares?
- If the regression sum of squares is 440.03, what is the sum of squared errors?
- If the regression sum of squares is 440.03, what is the \(R^2\) value?
- If the regression sum of squares is 440.03, what is the estimated residual variance?
(Question ID: 0268605384)
Information on an outcome and predictor are collected, with the goal of regressing the outcome on the predictor.
In the sample of 52 observations, the mean of the predictor was 1.36, with a standard deviation of 1.04. Further, the mean of the outcome was 0.24, with a standard deviation of 13.75. The covariance between the two was 4.53.
- What is the estimated value of the intercept in the least squares regression line?
- What is the estimated value of the slope in the least squares regression line?
- What is the predicted value of the outcome, if the predictor takes a value of 2.92?
- What is the predicted change in the outcome, if the predictor is increased by 2?
- What is the total sum of squares?
- If the sum of squared errors is 8667.95, what is the regression sum of squares?
- If the sum of squared errors is 8667.95, what is the coefficient of determination?
- If the sum of squared errors is 8667.95, what is the estimated residual variance?
(Question ID: 0905241979)
Information on an outcome and predictor are collected, with the goal of regressing the outcome on the predictor.
In the sample of 94 observations, the mean of the predictor was -7.73, with a standard deviation of 6.31. Further, the mean of the outcome was -12.11, with a standard deviation of 228.65. The covariance between the two was 121.57.
- What is the estimated value of the intercept in the least squares regression line?
- What is the estimated value of the slope in the least squares regression line?
- What is the predicted value of the outcome, if the predictor takes a value of -6.53?
- What is the predicted change in the outcome, if the predictor is decreased by 17?
- What is the total sum of squares?
- If the regression sum of squares is 34563.32, what is the sum of squared errors?
- If the regression sum of squares is 34563.32, what is the coefficient of determination?
- If the regression sum of squares is 34563.32, what is the estimated residual variance?
(Question ID: 0938409955)
Information on an outcome and predictor are collected, with the goal of regressing the outcome on the predictor.
In the sample of 93 observations, the mean of the predictor was -10.09, with a standard deviation of 7.28. Further, the mean of the outcome was 53.27, with a standard deviation of 87.79. The covariance between the two was -306.95.
- What is the estimated value of the intercept in the least squares regression line?
- What is the estimated value of the slope in the least squares regression line?
- What is the predicted value of the outcome, if the predictor takes a value of -22.84?
- What is the predicted change in the outcome, if the predictor is decreased by 9?
- What is the total sum of squares?
- If the regression sum of squares is 163575.6, what is the sum of squared errors?
- If the regression sum of squares is 163575.6, what is the \(R^2\) value?
- If the regression sum of squares is 163575.6, what is the estimated residual variance?
(Question ID: 0948384990)
Information on an outcome and predictor are collected, with the goal of regressing the outcome on the predictor.
In the sample of 32 observations, the mean of the predictor was -4.3, with a standard deviation of 2.63. Further, the mean of the outcome was -2.82, with a standard deviation of 44.11. The covariance between the two was -4.3.
- What is the estimated value of the intercept in the least squares regression line?
- What is the estimated value of the slope in the least squares regression line?
- What is the predicted value of the outcome, if the predictor takes a value of -3.7?
- What is the predicted change in the outcome, if the predictor is decreased by 5?
- What is the total sum of squares?
- If the regression sum of squares is 96.09, what is the sum of squared errors?
- If the regression sum of squares is 96.09, what is the coefficient of determination?
- If the regression sum of squares is 96.09, what is the estimated conditional variance?
(Question ID: 0648375400)
Information on an outcome and predictor are collected, with the goal of regressing the outcome on the predictor.
In the sample of 73 observations, the mean of the predictor was -2.3, with a standard deviation of 1.89. Further, the mean of the outcome was 3.48, with a standard deviation of 17.33. The covariance between the two was -10.87.
- What is the estimated value of the intercept in the least squares regression line?
- What is the estimated value of the slope in the least squares regression line?
- What is the predicted value of the outcome, if the predictor takes a value of -6.82?
- What is the predicted change in the outcome, if the predictor is decreased by 2?
- What is the total sum of squares?
- If the sum of squared errors is 19238.1, what is the regression sum of squares?
- If the sum of squared errors is 19238.1, what is the coefficient of determination?
- If the sum of squared errors is 19238.1, what is the estimated conditional variance?
(Question ID: 0922240961)
Information on an outcome and predictor are collected, with the goal of regressing the outcome on the predictor.
In the sample of 68 observations, the mean of the predictor was -5.2, with a standard deviation of 6.52. Further, the mean of the outcome was -3.43, with a standard deviation of 26.1. The covariance between the two was 47.47.
- What is the estimated value of the intercept in the least squares regression line?
- What is the estimated value of the slope in the least squares regression line?
- What is the predicted value of the outcome, if the predictor takes a value of -23?
- What is the predicted change in the outcome, if the predictor is decreased by 34?
- What is the total sum of squares?
- If the sum of squared errors is 42080.62, what is the regression sum of squares?
- If the sum of squared errors is 42080.62, what is the coefficient of determination?
- If the sum of squared errors is 42080.62, what is the estimated conditional variance?
(Question ID: 0437886346)
Information on an outcome and predictor are collected, with the goal of regressing the outcome on the predictor.
In the sample of 63 observations, the mean of the predictor was 4.41, with a standard deviation of 4.94. Further, the mean of the outcome was 18.46, with a standard deviation of 40.11. The covariance between the two was 62.87.
- What is the estimated value of the intercept in the least squares regression line?
- What is the estimated value of the slope in the least squares regression line?
- What is the predicted value of the outcome, if the predictor takes a value of 16.35?
- What is the predicted change in the outcome, if the predictor is decreased by 23?
- What is the total sum of squares?
- If the regression sum of squares is 10073.02, what is the sum of squared errors?
- If the regression sum of squares is 10073.02, what is the \(R^2\) value?
- If the regression sum of squares is 10073.02, what is the estimated conditional variance?
(Question ID: 0380258535)
Information on an outcome and predictor are collected, with the goal of regressing the outcome on the predictor.
In the sample of 66 observations, the mean of the predictor was 0.03, with a standard deviation of 6.21. Further, the mean of the outcome was -2.35, with a standard deviation of 0.88. The covariance between the two was -1.5.
- What is the estimated value of the intercept in the least squares regression line?
- What is the estimated value of the slope in the least squares regression line?
- What is the predicted value of the outcome, if the predictor takes a value of -4.71?
- What is the predicted change in the outcome, if the predictor is increased by 28?
- What is the total sum of squares?
- If the sum of squared errors is 46.73, what is the regression sum of squares?
- If the sum of squared errors is 46.73, what is the \(R^2\) value?
- If the sum of squared errors is 46.73, what is the estimated conditional variance?
(Question ID: 0860255156)
Information on an outcome and predictor are collected, with the goal of regressing the outcome on the predictor.
In the sample of 54 observations, the mean of the predictor was 6.05, with a standard deviation of 2.89. Further, the mean of the outcome was -14.35, with a standard deviation of 44.04. The covariance between the two was -46.41.
- What is the estimated value of the intercept in the least squares regression line?
- What is the estimated value of the slope in the least squares regression line?
- What is the predicted value of the outcome, if the predictor takes a value of -0.43?
- What is the predicted change in the outcome, if the predictor is increased by 2?
- What is the total sum of squares?
- If the sum of squared errors is 89153.5, what is the regression sum of squares?
- If the sum of squared errors is 89153.5, what is the coefficient of determination?
- If the sum of squared errors is 89153.5, what is the estimated residual variance?
(Question ID: 0833818408)
Information on an outcome and predictor are collected, with the goal of regressing the outcome on the predictor.
In the sample of 89 observations, the mean of the predictor was 1.4, with a standard deviation of 9.67. Further, the mean of the outcome was -6.9, with a standard deviation of 260.95. The covariance between the two was 573.82.
- What is the estimated value of the intercept in the least squares regression line?
- What is the estimated value of the slope in the least squares regression line?
- What is the predicted value of the outcome, if the predictor takes a value of -12.59?
- What is the predicted change in the outcome, if the predictor is increased by 14?
- What is the total sum of squares?
- If the sum of squared errors is 5682624, what is the regression sum of squares?
- If the sum of squared errors is 5682624, what is the \(R^2\) value?
- If the sum of squared errors is 5682624, what is the estimated conditional variance?
(Question ID: 0934040759)
Information on an outcome and predictor are collected, with the goal of regressing the outcome on the predictor.
In the sample of 37 observations, the mean of the predictor was -2.19, with a standard deviation of 5.82. Further, the mean of the outcome was 5.96, with a standard deviation of 104.88. The covariance between the two was -114.89.
- What is the estimated value of the intercept in the least squares regression line?
- What is the estimated value of the slope in the least squares regression line?
- What is the predicted value of the outcome, if the predictor takes a value of 5?
- What is the predicted change in the outcome, if the predictor is increased by 17?
- What is the total sum of squares?
- If the regression sum of squares is 14028.27, what is the sum of squared errors?
- If the regression sum of squares is 14028.27, what is the coefficient of determination?
- If the regression sum of squares is 14028.27, what is the estimated conditional variance?
(Question ID: 0958110899)
Information on an outcome and predictor are collected, with the goal of regressing the outcome on the predictor.
In the sample of 61 observations, the mean of the predictor was 8.89, with a standard deviation of 6.78. Further, the mean of the outcome was -24.1, with a standard deviation of 40.49. The covariance between the two was -66.82.
- What is the estimated value of the intercept in the least squares regression line?
- What is the estimated value of the slope in the least squares regression line?
- What is the predicted value of the outcome, if the predictor takes a value of 15.01?
- What is the predicted change in the outcome, if the predictor is decreased by 27?
- What is the total sum of squares?
- If the sum of squared errors is 92520.71, what is the regression sum of squares?
- If the sum of squared errors is 92520.71, what is the \(R^2\) value?
- If the sum of squared errors is 92520.71, what is the estimated residual variance?
(Question ID: 0549604779)
Information on an outcome and predictor are collected, with the goal of regressing the outcome on the predictor.
In the sample of 72 observations, the mean of the predictor was 6.92, with a standard deviation of 3.72. Further, the mean of the outcome was -7.08, with a standard deviation of 3.96. The covariance between the two was -10.94.
- What is the estimated value of the intercept in the least squares regression line?
- What is the estimated value of the slope in the least squares regression line?
- What is the predicted value of the outcome, if the predictor takes a value of 10.62?
- What is the predicted change in the outcome, if the predictor is increased by 8?
- What is the total sum of squares?
- If the sum of squared errors is 499.06, what is the regression sum of squares?
- If the sum of squared errors is 499.06, what is the \(R^2\) value?
- If the sum of squared errors is 499.06, what is the mean squared error?
(Question ID: 0546236200)
Information on an outcome and predictor are collected, with the goal of regressing the outcome on the predictor.
In the sample of 98 observations, the mean of the predictor was -5.36, with a standard deviation of 9.56. Further, the mean of the outcome was -4.53, with a standard deviation of 6.73. The covariance between the two was 59.67.
- What is the estimated value of the intercept in the least squares regression line?
- What is the estimated value of the slope in the least squares regression line?
- What is the predicted value of the outcome, if the predictor takes a value of -20.44?
- What is the predicted change in the outcome, if the predictor is decreased by 48?
- What is the total sum of squares?
- If the regression sum of squares is 3780.94, what is the sum of squared errors?
- If the regression sum of squares is 3780.94, what is the \(R^2\) value?
- If the regression sum of squares is 3780.94, what is the estimated conditional variance?
(Question ID: 0183914999)
Information on an outcome and predictor are collected, with the goal of regressing the outcome on the predictor.
In the sample of 93 observations, the mean of the predictor was -9.15, with a standard deviation of 5. Further, the mean of the outcome was -33.6, with a standard deviation of 133.84. The covariance between the two was 100.4.
- What is the estimated value of the intercept in the least squares regression line?
- What is the estimated value of the slope in the least squares regression line?
- What is the predicted value of the outcome, if the predictor takes a value of -6.85?
- What is the predicted change in the outcome, if the predictor is increased by 10?
- What is the total sum of squares?
- If the regression sum of squares is 37160.69, what is the sum of squared errors?
- If the regression sum of squares is 37160.69, what is the coefficient of determination?
- If the regression sum of squares is 37160.69, what is the estimated conditional variance?
(Question ID: 0460652932)
Information on an outcome and predictor are collected, with the goal of regressing the outcome on the predictor.
In the sample of 42 observations, the mean of the predictor was 3.14, with a standard deviation of 1.2. Further, the mean of the outcome was 7.09, with a standard deviation of 15.86. The covariance between the two was 8.77.
- What is the estimated value of the intercept in the least squares regression line?
- What is the estimated value of the slope in the least squares regression line?
- What is the predicted value of the outcome, if the predictor takes a value of 2.63?
- What is the predicted change in the outcome, if the predictor is decreased by 2?
- What is the total sum of squares?
- If the regression sum of squares is 2185.6, what is the sum of squared errors?
- If the regression sum of squares is 2185.6, what is the coefficient of determination?
- If the regression sum of squares is 2185.6, what is the mean squared error?
(Question ID: 0371577668)
Information on an outcome and predictor are collected, with the goal of regressing the outcome on the predictor.
In the sample of 56 observations, the mean of the predictor was 9.76, with a standard deviation of 5.86. Further, the mean of the outcome was -16.48, with a standard deviation of 15.48. The covariance between the two was -60.76.
- What is the estimated value of the intercept in the least squares regression line?
- What is the estimated value of the slope in the least squares regression line?
- What is the predicted value of the outcome, if the predictor takes a value of 3.17?
- What is the predicted change in the outcome, if the predictor is increased by 3?
- What is the total sum of squares?
- If the regression sum of squares is 5905.05, what is the sum of squared errors?
- If the regression sum of squares is 5905.05, what is the coefficient of determination?
- If the regression sum of squares is 5905.05, what is the mean squared error?
(Question ID: 0303541056)
Information on an outcome and predictor are collected, with the goal of regressing the outcome on the predictor.
In the sample of 63 observations, the mean of the predictor was 6.69, with a standard deviation of 2.11. Further, the mean of the outcome was -28.17, with a standard deviation of 25.59. The covariance between the two was -22.58.
- What is the estimated value of the intercept in the least squares regression line?
- What is the estimated value of the slope in the least squares regression line?
- What is the predicted value of the outcome, if the predictor takes a value of 4.07?
- What is the predicted change in the outcome, if the predictor is decreased by 4?
- What is the total sum of squares?
- If the regression sum of squares is 7102.04, what is the sum of squared errors?
- If the regression sum of squares is 7102.04, what is the \(R^2\) value?
- If the regression sum of squares is 7102.04, what is the estimated conditional variance?
(Question ID: 0770243050)
Information on an outcome and predictor are collected, with the goal of regressing the outcome on the predictor.
In the sample of 75 observations, the mean of the predictor was 1.57, with a standard deviation of 9.82. Further, the mean of the outcome was -5.11, with a standard deviation of 320.1. The covariance between the two was 122.52.
- What is the estimated value of the intercept in the least squares regression line?
- What is the estimated value of the slope in the least squares regression line?
- What is the predicted value of the outcome, if the predictor takes a value of 8.89?
- What is the predicted change in the outcome, if the predictor is increased by 44?
- What is the total sum of squares?
- If the sum of squared errors is 7570929, what is the regression sum of squares?
- If the sum of squared errors is 7570929, what is the coefficient of determination?
- If the sum of squared errors is 7570929, what is the estimated residual variance?
(Question ID: 0267322212)
Information on an outcome and predictor are collected, with the goal of regressing the outcome on the predictor.
In the sample of 81 observations, the mean of the predictor was 7.37, with a standard deviation of 5.71. Further, the mean of the outcome was -12.19, with a standard deviation of 17.86. The covariance between the two was -67.34.
- What is the estimated value of the intercept in the least squares regression line?
- What is the estimated value of the slope in the least squares regression line?
- What is the predicted value of the outcome, if the predictor takes a value of 5.84?
- What is the predicted change in the outcome, if the predictor is increased by 25?
- What is the total sum of squares?
- If the regression sum of squares is 11125.7, what is the sum of squared errors?
- If the regression sum of squares is 11125.7, what is the coefficient of determination?
- If the regression sum of squares is 11125.7, what is the mean squared error?
(Question ID: 0600453613)
Information on an outcome and predictor are collected, with the goal of regressing the outcome on the predictor.
In the sample of 83 observations, the mean of the predictor was -6.23, with a standard deviation of 2.94. Further, the mean of the outcome was 34.9, with a standard deviation of 75.21. The covariance between the two was 10.83.
- What is the estimated value of the intercept in the least squares regression line?
- What is the estimated value of the slope in the least squares regression line?
- What is the predicted value of the outcome, if the predictor takes a value of -3.51?
- What is the predicted change in the outcome, if the predictor is increased by 5?
- What is the total sum of squares?
- If the sum of squared errors is 462773.5, what is the regression sum of squares?
- If the sum of squared errors is 462773.5, what is the \(R^2\) value?
- If the sum of squared errors is 462773.5, what is the mean squared error?
(Question ID: 0741255930)
Information on an outcome and predictor are collected, with the goal of regressing the outcome on the predictor.
In the sample of 98 observations, the mean of the predictor was -4.94, with a standard deviation of 3.6. Further, the mean of the outcome was -18.44, with a standard deviation of 120.22. The covariance between the two was 65.65.
- What is the estimated value of the intercept in the least squares regression line?
- What is the estimated value of the slope in the least squares regression line?
- What is the predicted value of the outcome, if the predictor takes a value of -5?
- What is the predicted change in the outcome, if the predictor is increased by 7?
- What is the total sum of squares?
- If the regression sum of squares is 32271.68, what is the sum of squared errors?
- If the regression sum of squares is 32271.68, what is the coefficient of determination?
- If the regression sum of squares is 32271.68, what is the estimated conditional variance?
(Question ID: 0529412333)
Information on an outcome and predictor are collected, with the goal of regressing the outcome on the predictor.
In the sample of 51 observations, the mean of the predictor was -4.56, with a standard deviation of 10.94. Further, the mean of the outcome was -13.78, with a standard deviation of 42.84. The covariance between the two was 246.08.
- What is the estimated value of the intercept in the least squares regression line?
- What is the estimated value of the slope in the least squares regression line?
- What is the predicted value of the outcome, if the predictor takes a value of -2.43?
- What is the predicted change in the outcome, if the predictor is increased by 25?
- What is the total sum of squares?
- If the sum of squared errors is 66454.66, what is the regression sum of squares?
- If the sum of squared errors is 66454.66, what is the coefficient of determination?
- If the sum of squared errors is 66454.66, what is the estimated residual variance?
(Question ID: 0261670303)
Information on an outcome and predictor are collected, with the goal of regressing the outcome on the predictor.
In the sample of 37 observations, the mean of the predictor was 8.93, with a standard deviation of 8.7. Further, the mean of the outcome was 13.61, with a standard deviation of 391.18. The covariance between the two was -1194.39.
- What is the estimated value of the intercept in the least squares regression line?
- What is the estimated value of the slope in the least squares regression line?
- What is the predicted value of the outcome, if the predictor takes a value of -9.15?
- What is the predicted change in the outcome, if the predictor is decreased by 24?
- What is the total sum of squares?
- If the regression sum of squares is 678169.5, what is the sum of squared errors?
- If the regression sum of squares is 678169.5, what is the coefficient of determination?
- If the regression sum of squares is 678169.5, what is the estimated residual variance?
(Question ID: 0277905613)
Information on an outcome and predictor are collected, with the goal of regressing the outcome on the predictor.
In the sample of 83 observations, the mean of the predictor was 8, with a standard deviation of 5.09. Further, the mean of the outcome was 22.78, with a standard deviation of 22.12. The covariance between the two was 48.56.
- What is the estimated value of the intercept in the least squares regression line?
- What is the estimated value of the slope in the least squares regression line?
- What is the predicted value of the outcome, if the predictor takes a value of 9.99?
- What is the predicted change in the outcome, if the predictor is decreased by 17?
- What is the total sum of squares?
- If the sum of squared errors is 32656.02, what is the regression sum of squares?
- If the sum of squared errors is 32656.02, what is the \(R^2\) value?
- If the sum of squared errors is 32656.02, what is the estimated conditional variance?
(Question ID: 0359710410)
Information on an outcome and predictor are collected, with the goal of regressing the outcome on the predictor.
In the sample of 60 observations, the mean of the predictor was -4.41, with a standard deviation of 6.25. Further, the mean of the outcome was -36.03, with a standard deviation of 99.95. The covariance between the two was 71.03.
- What is the estimated value of the intercept in the least squares regression line?
- What is the estimated value of the slope in the least squares regression line?
- What is the predicted value of the outcome, if the predictor takes a value of 5.08?
- What is the predicted change in the outcome, if the predictor is increased by 6?
- What is the total sum of squares?
- If the regression sum of squares is 7577.28, what is the sum of squared errors?
- If the regression sum of squares is 7577.28, what is the \(R^2\) value?
- If the regression sum of squares is 7577.28, what is the estimated conditional variance?
(Question ID: 0263589789)
Information on an outcome and predictor are collected, with the goal of regressing the outcome on the predictor.
In the sample of 95 observations, the mean of the predictor was -0.51, with a standard deviation of 7.46. Further, the mean of the outcome was -0.56, with a standard deviation of 270.3. The covariance between the two was 119.05.
- What is the estimated value of the intercept in the least squares regression line?
- What is the estimated value of the slope in the least squares regression line?
- What is the predicted value of the outcome, if the predictor takes a value of 12.49?
- What is the predicted change in the outcome, if the predictor is increased by 14?
- What is the total sum of squares?
- If the regression sum of squares is 23875.22, what is the sum of squared errors?
- If the regression sum of squares is 23875.22, what is the coefficient of determination?
- If the regression sum of squares is 23875.22, what is the estimated conditional variance?
(Question ID: 0798709893)
Information on an outcome and predictor are collected, with the goal of regressing the outcome on the predictor.
In the sample of 45 observations, the mean of the predictor was 2.79, with a standard deviation of 2.94. Further, the mean of the outcome was -6.41, with a standard deviation of 18.58. The covariance between the two was -22.97.
- What is the estimated value of the intercept in the least squares regression line?
- What is the estimated value of the slope in the least squares regression line?
- What is the predicted value of the outcome, if the predictor takes a value of 0.62?
- What is the predicted change in the outcome, if the predictor is increased by 2?
- What is the total sum of squares?
- If the regression sum of squares is 2685.45, what is the sum of squared errors?
- If the regression sum of squares is 2685.45, what is the \(R^2\) value?
- If the regression sum of squares is 2685.45, what is the estimated residual variance?
(Question ID: 0537955981)
Information on an outcome and predictor are collected, with the goal of regressing the outcome on the predictor.
In the sample of 91 observations, the mean of the predictor was 6.67, with a standard deviation of 9.69. Further, the mean of the outcome was 15.66, with a standard deviation of 294.49. The covariance between the two was 695.09.
- What is the estimated value of the intercept in the least squares regression line?
- What is the estimated value of the slope in the least squares regression line?
- What is the predicted value of the outcome, if the predictor takes a value of -2.9?
- What is the predicted change in the outcome, if the predictor is increased by 34?
- What is the total sum of squares?
- If the sum of squared errors is 7342180, what is the regression sum of squares?
- If the sum of squared errors is 7342180, what is the \(R^2\) value?
- If the sum of squared errors is 7342180, what is the estimated residual variance?
(Question ID: 0914945337)
Information on an outcome and predictor are collected, with the goal of regressing the outcome on the predictor.
In the sample of 85 observations, the mean of the predictor was 7.14, with a standard deviation of 2.15. Further, the mean of the outcome was 16.42, with a standard deviation of 8.59. The covariance between the two was 9.35.
- What is the estimated value of the intercept in the least squares regression line?
- What is the estimated value of the slope in the least squares regression line?
- What is the predicted value of the outcome, if the predictor takes a value of 6.24?
- What is the predicted change in the outcome, if the predictor is increased by 13?
- What is the total sum of squares?
- If the regression sum of squares is 1593.99, what is the sum of squared errors?
- If the regression sum of squares is 1593.99, what is the coefficient of determination?
- If the regression sum of squares is 1593.99, what is the estimated conditional variance?
(Question ID: 0536914645)
Information on an outcome and predictor are collected, with the goal of regressing the outcome on the predictor.
In the sample of 72 observations, the mean of the predictor was 6.37, with a standard deviation of 5.04. Further, the mean of the outcome was 5.43, with a standard deviation of 103.72. The covariance between the two was -70.93.
- What is the estimated value of the intercept in the least squares regression line?
- What is the estimated value of the slope in the least squares regression line?
- What is the predicted value of the outcome, if the predictor takes a value of 15.67?
- What is the predicted change in the outcome, if the predictor is increased by 6?
- What is the total sum of squares?
- If the sum of squared errors is 749809.3, what is the regression sum of squares?
- If the sum of squared errors is 749809.3, what is the \(R^2\) value?
- If the sum of squared errors is 749809.3, what is the mean squared error?
(Question ID: 0755733003)
Information on an outcome and predictor are collected, with the goal of regressing the outcome on the predictor.
In the sample of 33 observations, the mean of the predictor was -7, with a standard deviation of 1.14. Further, the mean of the outcome was -35.84, with a standard deviation of 12.9. The covariance between the two was 3.27.
- What is the estimated value of the intercept in the least squares regression line?
- What is the estimated value of the slope in the least squares regression line?
- What is the predicted value of the outcome, if the predictor takes a value of -5.79?
- What is the predicted change in the outcome, if the predictor is decreased by 5?
- What is the total sum of squares?
- If the sum of squared errors is 5061.46, what is the regression sum of squares?
- If the sum of squared errors is 5061.46, what is the \(R^2\) value?
- If the sum of squared errors is 5061.46, what is the mean squared error?
(Question ID: 0074427170)
Information on an outcome and predictor are collected, with the goal of regressing the outcome on the predictor.
In the sample of 56 observations, the mean of the predictor was -4.08, with a standard deviation of 1.05. Further, the mean of the outcome was -5.65, with a standard deviation of 4.09. The covariance between the two was 1.45.
- What is the estimated value of the intercept in the least squares regression line?
- What is the estimated value of the slope in the least squares regression line?
- What is the predicted value of the outcome, if the predictor takes a value of -5.49?
- What is the predicted change in the outcome, if the predictor is decreased by 3?
- What is the total sum of squares?
- If the regression sum of squares is 105.17, what is the sum of squared errors?
- If the regression sum of squares is 105.17, what is the coefficient of determination?
- If the regression sum of squares is 105.17, what is the mean squared error?
(Question ID: 0186189681)
Information on an outcome and predictor are collected, with the goal of regressing the outcome on the predictor.
In the sample of 65 observations, the mean of the predictor was -10.53, with a standard deviation of 3.08. Further, the mean of the outcome was 31.1, with a standard deviation of 56.75. The covariance between the two was -11.26.
- What is the estimated value of the intercept in the least squares regression line?
- What is the estimated value of the slope in the least squares regression line?
- What is the predicted value of the outcome, if the predictor takes a value of -13.66?
- What is the predicted change in the outcome, if the predictor is decreased by 3?
- What is the total sum of squares?
- If the sum of squared errors is 205276.4, what is the regression sum of squares?
- If the sum of squared errors is 205276.4, what is the \(R^2\) value?
- If the sum of squared errors is 205276.4, what is the mean squared error?
(Question ID: 0353007417)
Information on an outcome and predictor are collected, with the goal of regressing the outcome on the predictor.
In the sample of 94 observations, the mean of the predictor was 6.91, with a standard deviation of 7.73. Further, the mean of the outcome was -23.32, with a standard deviation of 80.36. The covariance between the two was -253.84.
- What is the estimated value of the intercept in the least squares regression line?
- What is the estimated value of the slope in the least squares regression line?
- What is the predicted value of the outcome, if the predictor takes a value of -6.07?
- What is the predicted change in the outcome, if the predictor is increased by 11?
- What is the total sum of squares?
- If the regression sum of squares is 100256.3, what is the sum of squared errors?
- If the regression sum of squares is 100256.3, what is the coefficient of determination?
- If the regression sum of squares is 100256.3, what is the estimated conditional variance?
(Question ID: 0450834737)
Information on an outcome and predictor are collected, with the goal of regressing the outcome on the predictor.
In the sample of 52 observations, the mean of the predictor was 1.43, with a standard deviation of 5.23. Further, the mean of the outcome was -4.57, with a standard deviation of 92.44. The covariance between the two was -105.96.
- What is the estimated value of the intercept in the least squares regression line?
- What is the estimated value of the slope in the least squares regression line?
- What is the predicted value of the outcome, if the predictor takes a value of 6.12?
- What is the predicted change in the outcome, if the predictor is decreased by 21?
- What is the total sum of squares?
- If the sum of squared errors is 414858, what is the regression sum of squares?
- If the sum of squared errors is 414858, what is the \(R^2\) value?
- If the sum of squared errors is 414858, what is the estimated conditional variance?
(Question ID: 0596875680)
A marketing team is exploring the relationship between the amount spent on advertising and product sales.
The results of the analysis are summarized in the following regression table.
| Characteristic | Beta | SE1 | p-value |
|---|---|---|---|
| Intercept | 114 | 5.10 | <0.001 |
| Advertising Spend | 2.5 | 0.016 | <0.001 |
| No. Obs. = 74; Sigma = 17.9; R² = 0.997 | |||
| 1 SE = Standard Error | |||
The mean advertising spend is 282.24, with a standard deviation of 127.03.
- What is the predicted product sales if advertising spend is 447.74?
- What is the value of the test statistic for testing \(H_0: \beta_1 = 2.5\)?
- Give an \(89\%\) confidence interval for \(\beta_0\).
Lower Bound: Upper Bound:
- Give an \(89\%\) confidence interval for \(\beta_1\)
Lower Bound: Upper Bound:
- Give an \(89\%\) confidence interval for the expected product sales, if the advertising spend is 211.67.
Lower Bound: Upper Bound:
- Give an \(89\%\) prediction interval for the product sales, if the advertising spend is 211.67.
Lower Bound: Upper Bound:
(Question ID: 0646203974)
A fitness instructor is looking at the relationship between the number of push-ups a person can do and their cardiovascular health score.
The results of the analysis are summarized in the following regression table.
| Characteristic | Beta | SE1 | p-value |
|---|---|---|---|
| Intercept | 61 | 0.883 | <0.001 |
| Number Of Push-Ups | 0.46 | 0.031 | <0.001 |
| No. Obs. = 100; Sigma = 4.41; R² = 0.695 | |||
| 1 SE = Standard Error | |||
The mean number of push-ups is 24.85, with a standard deviation of 14.42.
- What is the predicted cardiovascular health score if number of push-ups is 30.88?
- What is the value of the test statistic for testing \(H_0: \beta_1 = 0.45\)?
- Give a \(95\%\) confidence interval for \(\beta_0\).
Lower Bound: Upper Bound:
- Give a \(95\%\) confidence interval for \(\beta_1\)
Lower Bound: Upper Bound:
- Give a \(95\%\) confidence interval for the expected cardiovascular health score, if the number of push-ups is 31.51.
Lower Bound: Upper Bound:
- Give a \(95\%\) prediction interval for the cardiovascular health score, if the number of push-ups is 31.51.
Lower Bound: Upper Bound:
(Question ID: 0493482226)
A musician is exploring if there is a relationship between the number of practice hours and performance quality.
The results of the analysis are summarized in the following regression table.
| Characteristic | Beta | SE1 | p-value |
|---|---|---|---|
| Intercept | 3.1 | 0.284 | <0.001 |
| Practice Hours | 0.81 | 0.024 | <0.001 |
| No. Obs. = 99; Sigma = 1.47; R² = 0.921 | |||
| 1 SE = Standard Error | |||
The mean practice hours is 10.14, with a standard deviation of 6.19.
- What is the predicted performance quality if practice hours is 16.79?
- What is the value of the test statistic for testing \(H_0: \beta_1 = 0.82\)?
- Give a \(92\%\) confidence interval for \(\beta_0\).
Lower Bound: Upper Bound:
- Give a \(92\%\) confidence interval for \(\beta_1\)
Lower Bound: Upper Bound:
- Give a \(92\%\) confidence interval for the expected performance quality, if the practice hours is 4.23.
Lower Bound: Upper Bound:
- Give a \(92\%\) prediction interval for the performance quality, if the practice hours is 4.23.
Lower Bound: Upper Bound:
(Question ID: 0713401067)
A fitness instructor is looking at the relationship between the number of push-ups a person can do and their cardiovascular health score.
The results of the analysis are summarized in the following regression table.
| Characteristic | Beta | SE1 | p-value |
|---|---|---|---|
| Intercept | 61 | 2.13 | <0.001 |
| Number Of Push-Ups | 0.50 | 0.076 | <0.001 |
| No. Obs. = 35; Sigma = 6.33; R² = 0.564 | |||
| 1 SE = Standard Error | |||
The mean number of push-ups is 24.14, with a standard deviation of 14.23.
- What is the predicted cardiovascular health score if number of push-ups is 5.65?
- What is the value of the test statistic for testing \(H_0: \beta_1 = 0.53\)?
- Give an \(83\%\) confidence interval for \(\beta_0\).
Lower Bound: Upper Bound:
- Give an \(83\%\) confidence interval for \(\beta_1\)
Lower Bound: Upper Bound:
- Give an \(83\%\) confidence interval for the expected cardiovascular health score, if the number of push-ups is 5.37.
Lower Bound: Upper Bound:
- Give an \(83\%\) prediction interval for the cardiovascular health score, if the number of push-ups is 5.37.
Lower Bound: Upper Bound:
(Question ID: 0716002831)
A store owner wants to use linear regression to understand the relationship between a diamond’s cost and the number of carats it is.
The results of the analysis are summarized in the following regression table.
| Characteristic | Beta | SE1 | p-value |
|---|---|---|---|
| Intercept | -2,355 | 291 | <0.001 |
| Carat | 7,772 | 111 | <0.001 |
| No. Obs. = 87; Sigma = 1,462; R² = 0.983 | |||
| 1 SE = Standard Error | |||
The mean carat is 2.21, with a standard deviation of 1.42.
- What is the predicted cost if carat is 2.01?
- What is the value of the test statistic for testing \(H_0: \beta_1 = 7765.34\)?
- Give an \(84\%\) confidence interval for \(\beta_0\).
Lower Bound: Upper Bound:
- Give an \(84\%\) confidence interval for \(\beta_1\)
Lower Bound: Upper Bound:
- Give an \(84\%\) confidence interval for the expected cost, if the carat is 2.5.
Lower Bound: Upper Bound:
- Give an \(84\%\) prediction interval for the cost, if the carat is 2.5.
Lower Bound: Upper Bound:
(Question ID: 0281143641)
A software engineer is analyzing if the number of lines of code affects the number of bugs.
The results of the analysis are summarized in the following regression table.
| Characteristic | Beta | SE1 | p-value |
|---|---|---|---|
| Intercept | 1.8 | 0.949 | 0.070 |
| Lines Of Code | 0.01 | 0.000 | <0.001 |
| No. Obs. = 39; Sigma = 2.93; R² = 0.964 | |||
| 1 SE = Standard Error | |||
The mean lines of code is 2622.8, with a standard deviation of 1514.38.
- What is the predicted number of bugs if lines of code is 1473.59?
- What is the value of the test statistic for testing \(H_0: \beta_1 = 0.01\)?
- Give a \(96\%\) confidence interval for \(\beta_0\).
Lower Bound: Upper Bound:
- Give a \(96\%\) confidence interval for \(\beta_1\)
Lower Bound: Upper Bound:
- Give a \(96\%\) confidence interval for the expected number of bugs, if the lines of code is 3698.84.
Lower Bound: Upper Bound:
- Give a \(96\%\) prediction interval for the number of bugs, if the lines of code is 3698.84.
Lower Bound: Upper Bound:
(Question ID: 0763224969)
An economist wants to see if there’s a relationship between a country’s GDP and its average life expectancy.
The results of the analysis are summarized in the following regression table.
| Characteristic | Beta | SE1 | p-value |
|---|---|---|---|
| Intercept | 65 | 0.557 | <0.001 |
| Gdp | 0.00 | 0.000 | <0.001 |
| No. Obs. = 39; Sigma = 1.91; R² = 0.780 | |||
| 1 SE = Standard Error | |||
The mean GDP is 4.87674^{4}, with a standard deviation of 3.236842^{4}.
- What is the predicted life expectancy if GDP is 2971.7?
- What is the value of the test statistic for testing \(H_0: \beta_1 = 0\)?
- Give a \(96\%\) confidence interval for \(\beta_0\).
Lower Bound: Upper Bound:
- Give a \(96\%\) confidence interval for \(\beta_1\)
Lower Bound: Upper Bound:
- Give a \(96\%\) confidence interval for the expected life expectancy, if the GDP is 3.64801^{4}.
Lower Bound: Upper Bound:
- Give a \(96\%\) prediction interval for the life expectancy, if the GDP is 3.64801^{4}.
Lower Bound: Upper Bound:
(Question ID: 0736187679)
A city planner is examining the relationship between the distance from the city center and housing price.
The results of the analysis are summarized in the following regression table.
| Characteristic | Beta | SE1 | p-value |
|---|---|---|---|
| Intercept | 480,492 | 9,555 | <0.001 |
| Distance From City Center | -3,790 | 786 | <0.001 |
| No. Obs. = 36; Sigma = 26,092; R² = 0.406 | |||
| 1 SE = Standard Error | |||
The mean distance from city center is 10.82, with a standard deviation of 5.61.
- What is the predicted housing price if distance from city center is 2.22?
- What is the value of the test statistic for testing \(H_0: \beta_1 = -6061.54\)?
- Give an \(82\%\) confidence interval for \(\beta_0\).
Lower Bound: Upper Bound:
- Give an \(82\%\) confidence interval for \(\beta_1\)
Lower Bound: Upper Bound:
- Give an \(82\%\) confidence interval for the expected housing price, if the distance from city center is 1.87.
Lower Bound: Upper Bound:
- Give an \(82\%\) prediction interval for the housing price, if the distance from city center is 1.87.
Lower Bound: Upper Bound:
(Question ID: 0030908154)
A social scientist is studying the relationship between the number of social media followers and perceived popularity.
The results of the analysis are summarized in the following regression table.
| Characteristic | Beta | SE1 | p-value |
|---|---|---|---|
| Intercept | 2.0 | 0.162 | <0.001 |
| Number Of Followers | 0.00 | 0.000 | <0.001 |
| No. Obs. = 63; Sigma = 0.618; R² = 0.188 | |||
| 1 SE = Standard Error | |||
The mean number of followers is 4.680322^{4}, with a standard deviation of 2.577634^{4}.
- What is the predicted perceived popularity if number of followers is 4.418068^{4}?
- What is the value of the test statistic for testing \(H_0: \beta_1 = 0\)?
- Give an \(84\%\) confidence interval for \(\beta_0\).
Lower Bound: Upper Bound:
- Give an \(84\%\) confidence interval for \(\beta_1\)
Lower Bound: Upper Bound:
- Give an \(84\%\) confidence interval for the expected perceived popularity, if the number of followers is 4.403414^{4}.
Lower Bound: Upper Bound:
- Give an \(84\%\) prediction interval for the perceived popularity, if the number of followers is 4.403414^{4}.
Lower Bound: Upper Bound:
(Question ID: 0430344734)
A fitness instructor is looking at the relationship between the number of push-ups a person can do and their cardiovascular health score.
The results of the analysis are summarized in the following regression table.
| Characteristic | Beta | SE1 | p-value |
|---|---|---|---|
| Intercept | 61 | 1.96 | <0.001 |
| Number Of Push-Ups | 0.50 | 0.066 | <0.001 |
| No. Obs. = 36; Sigma = 5.28; R² = 0.634 | |||
| 1 SE = Standard Error | |||
The mean number of push-ups is 26.58, with a standard deviation of 13.59.
- What is the predicted cardiovascular health score if number of push-ups is 32.42?
- What is the value of the test statistic for testing \(H_0: \beta_1 = 0.73\)?
- Give a \(98\%\) confidence interval for \(\beta_0\).
Lower Bound: Upper Bound:
- Give a \(98\%\) confidence interval for \(\beta_1\)
Lower Bound: Upper Bound:
- Give a \(98\%\) confidence interval for the expected cardiovascular health score, if the number of push-ups is 20.19.
Lower Bound: Upper Bound:
- Give a \(98\%\) prediction interval for the cardiovascular health score, if the number of push-ups is 20.19.
Lower Bound: Upper Bound:
(Question ID: 0377489618)
A meteorologist is examining the relationship between air pressure and the probability of rain.
The results of the analysis are summarized in the following regression table.
| Characteristic | Beta | SE1 | p-value |
|---|---|---|---|
| Intercept | 0.74 | 0.899 | 0.4 |
| Air Pressure | 0.00 | 0.001 | 0.6 |
| No. Obs. = 57; Sigma = 0.091; R² = 0.004 | |||
| 1 SE = Standard Error | |||
The mean air pressure is 999.33, with a standard deviation of 13.54.
- What is the predicted probability of rain if air pressure is 987.16?
- What is the value of the test statistic for testing \(H_0: \beta_1 = 0\)?
- Give an \(89\%\) confidence interval for \(\beta_0\).
Lower Bound: Upper Bound:
- Give an \(89\%\) confidence interval for \(\beta_1\)
Lower Bound: Upper Bound:
- Give an \(89\%\) confidence interval for the expected probability of rain, if the air pressure is 1003.98.
Lower Bound: Upper Bound:
- Give an \(89\%\) prediction interval for the probability of rain, if the air pressure is 1003.98.
Lower Bound: Upper Bound:
(Question ID: 0574465221)
A teacher is examining if the number of hours studied affects a student’s exam score.
The results of the analysis are summarized in the following regression table.
| Characteristic | Beta | SE1 | p-value |
|---|---|---|---|
| Intercept | 38 | 2.29 | <0.001 |
| Study Hours | 7.5 | 0.267 | <0.001 |
| No. Obs. = 39; Sigma = 7.21; R² = 0.955 | |||
| 1 SE = Standard Error | |||
The mean study hours is 7.4, with a standard deviation of 4.39.
- What is the predicted exam score if study hours is 12.05?
- What is the value of the test statistic for testing \(H_0: \beta_1 = 7.74\)?
- Give an \(82\%\) confidence interval for \(\beta_0\).
Lower Bound: Upper Bound:
- Give an \(82\%\) confidence interval for \(\beta_1\)
Lower Bound: Upper Bound:
- Give an \(82\%\) confidence interval for the expected exam score, if the study hours is 14.13.
Lower Bound: Upper Bound:
- Give an \(82\%\) prediction interval for the exam score, if the study hours is 14.13.
Lower Bound: Upper Bound:
(Question ID: 0280746964)
A student is investigating if there is a relationship between the number of siblings and their grade point average.
The results of the analysis are summarized in the following regression table.
| Characteristic | Beta | SE1 | p-value |
|---|---|---|---|
| Intercept | 3.1 | 0.129 | <0.001 |
| Number Of Siblings | -0.05 | 0.047 | 0.3 |
| No. Obs. = 39; Sigma = 0.445; R² = 0.025 | |||
| 1 SE = Standard Error | |||
The mean number of siblings is 2.28, with a standard deviation of 1.53.
- What is the predicted grade point average if number of siblings is 1.6?
- What is the value of the test statistic for testing \(H_0: \beta_1 = -0.13\)?
- Give an \(86\%\) confidence interval for \(\beta_0\).
Lower Bound: Upper Bound:
- Give an \(86\%\) confidence interval for \(\beta_1\)
Lower Bound: Upper Bound:
- Give an \(86\%\) confidence interval for the expected grade point average, if the number of siblings is 0.68.
Lower Bound: Upper Bound:
- Give an \(86\%\) prediction interval for the grade point average, if the number of siblings is 0.68.
Lower Bound: Upper Bound:
(Question ID: 0911286437)
A software engineer is analyzing if the number of lines of code affects the number of bugs.
The results of the analysis are summarized in the following regression table.
| Characteristic | Beta | SE1 | p-value |
|---|---|---|---|
| Intercept | 0.87 | 0.653 | 0.2 |
| Lines Of Code | 0.01 | 0.000 | <0.001 |
| No. Obs. = 90; Sigma = 2.78; R² = 0.964 | |||
| 1 SE = Standard Error | |||
The mean lines of code is 2779.42, with a standard deviation of 1403.98.
- What is the predicted number of bugs if lines of code is 2416.02?
- What is the value of the test statistic for testing \(H_0: \beta_1 = 0.01\)?
- Give a \(97\%\) confidence interval for \(\beta_0\).
Lower Bound: Upper Bound:
- Give a \(97\%\) confidence interval for \(\beta_1\)
Lower Bound: Upper Bound:
- Give a \(97\%\) confidence interval for the expected number of bugs, if the lines of code is 1065.01.
Lower Bound: Upper Bound:
- Give a \(97\%\) prediction interval for the number of bugs, if the lines of code is 1065.01.
Lower Bound: Upper Bound:
(Question ID: 0930921015)
A meteorologist is examining the relationship between air pressure and the probability of rain.
The results of the analysis are summarized in the following regression table.
| Characteristic | Beta | SE1 | p-value |
|---|---|---|---|
| Intercept | 2.3 | 0.816 | 0.006 |
| Air Pressure | 0.00 | 0.001 | 0.015 |
| No. Obs. = 82; Sigma = 0.109; R² = 0.071 | |||
| 1 SE = Standard Error | |||
The mean air pressure is 1002.73, with a standard deviation of 14.86.
- What is the predicted probability of rain if air pressure is 1006.15?
- What is the value of the test statistic for testing \(H_0: \beta_1 = 0\)?
- Give a \(93\%\) confidence interval for \(\beta_0\).
Lower Bound: Upper Bound:
- Give a \(93\%\) confidence interval for \(\beta_1\)
Lower Bound: Upper Bound:
- Give a \(93\%\) confidence interval for the expected probability of rain, if the air pressure is 1014.94.
Lower Bound: Upper Bound:
- Give a \(93\%\) prediction interval for the probability of rain, if the air pressure is 1014.94.
Lower Bound: Upper Bound:
(Question ID: 0091797173)
A fitness instructor is looking at the relationship between the number of push-ups a person can do and their cardiovascular health score.
The results of the analysis are summarized in the following regression table.
| Characteristic | Beta | SE1 | p-value |
|---|---|---|---|
| Intercept | 62 | 1.37 | <0.001 |
| Number Of Push-Ups | 0.48 | 0.049 | <0.001 |
| No. Obs. = 59; Sigma = 5.16; R² = 0.632 | |||
| 1 SE = Standard Error | |||
The mean number of push-ups is 24.42, with a standard deviation of 13.89.
- What is the predicted cardiovascular health score if number of push-ups is 7.77?
- What is the value of the test statistic for testing \(H_0: \beta_1 = 0.5\)?
- Give an \(80\%\) confidence interval for \(\beta_0\).
Lower Bound: Upper Bound:
- Give an \(80\%\) confidence interval for \(\beta_1\)
Lower Bound: Upper Bound:
- Give an \(80\%\) confidence interval for the expected cardiovascular health score, if the number of push-ups is 48.51.
Lower Bound: Upper Bound:
- Give an \(80\%\) prediction interval for the cardiovascular health score, if the number of push-ups is 48.51.
Lower Bound: Upper Bound:
(Question ID: 0056555751)
A city planner is examining the relationship between the distance from the city center and housing price.
The results of the analysis are summarized in the following regression table.
| Characteristic | Beta | SE1 | p-value |
|---|---|---|---|
| Intercept | 512,366 | 7,283 | <0.001 |
| Distance From City Center | -5,925 | 601 | <0.001 |
| No. Obs. = 54; Sigma = 25,942; R² = 0.651 | |||
| 1 SE = Standard Error | |||
The mean distance from city center is 10.59, with a standard deviation of 5.92.
- What is the predicted housing price if distance from city center is 16.62?
- What is the value of the test statistic for testing \(H_0: \beta_1 = -3581.1\)?
- Give an \(82\%\) confidence interval for \(\beta_0\).
Lower Bound: Upper Bound:
- Give an \(82\%\) confidence interval for \(\beta_1\)
Lower Bound: Upper Bound:
- Give an \(82\%\) confidence interval for the expected housing price, if the distance from city center is 3.64.
Lower Bound: Upper Bound:
- Give an \(82\%\) prediction interval for the housing price, if the distance from city center is 3.64.
Lower Bound: Upper Bound:
(Question ID: 0542339413)
A student is investigating if there is a relationship between the number of siblings and their grade point average.
The results of the analysis are summarized in the following regression table.
| Characteristic | Beta | SE1 | p-value |
|---|---|---|---|
| Intercept | 3.2 | 0.097 | <0.001 |
| Number Of Siblings | -0.06 | 0.033 | 0.054 |
| No. Obs. = 79; Sigma = 0.399; R² = 0.047 | |||
| 1 SE = Standard Error | |||
The mean number of siblings is 2.62, with a standard deviation of 1.38.
- What is the predicted grade point average if number of siblings is 0.19?
- What is the value of the test statistic for testing \(H_0: \beta_1 = -0.16\)?
- Give an \(85\%\) confidence interval for \(\beta_0\).
Lower Bound: Upper Bound:
- Give an \(85\%\) confidence interval for \(\beta_1\)
Lower Bound: Upper Bound:
- Give an \(85\%\) confidence interval for the expected grade point average, if the number of siblings is 2.08.
Lower Bound: Upper Bound:
- Give an \(85\%\) prediction interval for the grade point average, if the number of siblings is 2.08.
Lower Bound: Upper Bound:
(Question ID: 0823867301)
A scientist is investigating if there is a relationship between the temperature of a reaction and its rate.
The results of the analysis are summarized in the following regression table.
| Characteristic | Beta | SE1 | p-value |
|---|---|---|---|
| Intercept | 0.09 | 0.017 | <0.001 |
| Temperature | 0.02 | 0.000 | <0.001 |
| No. Obs. = 70; Sigma = 0.051; R² = 0.981 | |||
| 1 SE = Standard Error | |||
The mean temperature is 47.26, with a standard deviation of 18.15.
- What is the predicted reaction rate if temperature is 32.26?
- What is the value of the test statistic for testing \(H_0: \beta_1 = 0.02\)?
- Give an \(80\%\) confidence interval for \(\beta_0\).
Lower Bound: Upper Bound:
- Give an \(80\%\) confidence interval for \(\beta_1\)
Lower Bound: Upper Bound:
- Give an \(80\%\) confidence interval for the expected reaction rate, if the temperature is 37.2.
Lower Bound: Upper Bound:
- Give an \(80\%\) prediction interval for the reaction rate, if the temperature is 37.2.
Lower Bound: Upper Bound:
(Question ID: 0206756521)
A city planner is examining the relationship between the distance from the city center and housing price.
The results of the analysis are summarized in the following regression table.
| Characteristic | Beta | SE1 | p-value |
|---|---|---|---|
| Intercept | 492,011 | 7,952 | <0.001 |
| Distance From City Center | -4,158 | 693 | <0.001 |
| No. Obs. = 81; Sigma = 34,542; R² = 0.313 | |||
| 1 SE = Standard Error | |||
The mean distance from city center is 10.06, with a standard deviation of 5.58.
- What is the predicted housing price if distance from city center is 8.82?
- What is the value of the test statistic for testing \(H_0: \beta_1 = -3991.68\)?
- Give an \(85\%\) confidence interval for \(\beta_0\).
Lower Bound: Upper Bound:
- Give an \(85\%\) confidence interval for \(\beta_1\)
Lower Bound: Upper Bound:
- Give an \(85\%\) confidence interval for the expected housing price, if the distance from city center is 14.11.
Lower Bound: Upper Bound:
- Give an \(85\%\) prediction interval for the housing price, if the distance from city center is 14.11.
Lower Bound: Upper Bound:
(Question ID: 0850945483)
A store owner wants to use linear regression to understand the relationship between a diamond’s cost and the number of carats it is.
The results of the analysis are summarized in the following regression table.
| Characteristic | Beta | SE1 | p-value |
|---|---|---|---|
| Intercept | -2,079 | 417 | <0.001 |
| Carat | 7,633 | 133 | <0.001 |
| No. Obs. = 56; Sigma = 1,520; R² = 0.984 | |||
| 1 SE = Standard Error | |||
The mean carat is 2.74, with a standard deviation of 1.54.
- What is the predicted cost if carat is 4.96?
- What is the value of the test statistic for testing \(H_0: \beta_1 = 7291.19\)?
- Give an \(87\%\) confidence interval for \(\beta_0\).
Lower Bound: Upper Bound:
- Give an \(87\%\) confidence interval for \(\beta_1\)
Lower Bound: Upper Bound:
- Give an \(87\%\) confidence interval for the expected cost, if the carat is 0.58.
Lower Bound: Upper Bound:
- Give an \(87\%\) prediction interval for the cost, if the carat is 0.58.
Lower Bound: Upper Bound:
(Question ID: 0529815431)
A teacher is examining if the number of hours studied affects a student’s exam score.
The results of the analysis are summarized in the following regression table.
| Characteristic | Beta | SE1 | p-value |
|---|---|---|---|
| Intercept | 38 | 1.97 | <0.001 |
| Study Hours | 7.1 | 0.228 | <0.001 |
| No. Obs. = 72; Sigma = 8.22; R² = 0.934 | |||
| 1 SE = Standard Error | |||
The mean study hours is 7.52, with a standard deviation of 4.28.
- What is the predicted exam score if study hours is 1.03?
- What is the value of the test statistic for testing \(H_0: \beta_1 = 7.85\)?
- Give a \(90\%\) confidence interval for \(\beta_0\).
Lower Bound: Upper Bound:
- Give a \(90\%\) confidence interval for \(\beta_1\)
Lower Bound: Upper Bound:
- Give a \(90\%\) confidence interval for the expected exam score, if the study hours is 12.15.
Lower Bound: Upper Bound:
- Give a \(90\%\) prediction interval for the exam score, if the study hours is 12.15.
Lower Bound: Upper Bound:
(Question ID: 0836246059)
A social scientist is studying the relationship between the number of social media followers and perceived popularity.
The results of the analysis are summarized in the following regression table.
| Characteristic | Beta | SE1 | p-value |
|---|---|---|---|
| Intercept | 1.8 | 0.222 | <0.001 |
| Number Of Followers | 0.00 | 0.000 | <0.001 |
| No. Obs. = 44; Sigma = 0.822; R² = 0.235 | |||
| 1 SE = Standard Error | |||
The mean number of followers is 5.038851^{4}, with a standard deviation of 3.422518^{4}.
- What is the predicted perceived popularity if number of followers is 7.717242^{4}?
- What is the value of the test statistic for testing \(H_0: \beta_1 = 0\)?
- Give an \(87\%\) confidence interval for \(\beta_0\).
Lower Bound: Upper Bound:
- Give an \(87\%\) confidence interval for \(\beta_1\)
Lower Bound: Upper Bound:
- Give an \(87\%\) confidence interval for the expected perceived popularity, if the number of followers is 5.34311^{4}.
Lower Bound: Upper Bound:
- Give an \(87\%\) prediction interval for the perceived popularity, if the number of followers is 5.34311^{4}.
Lower Bound: Upper Bound:
(Question ID: 0107174925)
A marketing team is exploring the relationship between the amount spent on advertising and product sales.
The results of the analysis are summarized in the following regression table.
| Characteristic | Beta | SE1 | p-value |
|---|---|---|---|
| Intercept | 92 | 6.68 | <0.001 |
| Advertising Spend | 2.5 | 0.023 | <0.001 |
| No. Obs. = 54; Sigma = 21.9; R² = 0.996 | |||
| 1 SE = Standard Error | |||
The mean advertising spend is 259.85, with a standard deviation of 130.82.
- What is the predicted product sales if advertising spend is 494.18?
- What is the value of the test statistic for testing \(H_0: \beta_1 = 2.47\)?
- Give a \(99\%\) confidence interval for \(\beta_0\).
Lower Bound: Upper Bound:
- Give a \(99\%\) confidence interval for \(\beta_1\)
Lower Bound: Upper Bound:
- Give a \(99\%\) confidence interval for the expected product sales, if the advertising spend is 292.15.
Lower Bound: Upper Bound:
- Give a \(99\%\) prediction interval for the product sales, if the advertising spend is 292.15.
Lower Bound: Upper Bound:
(Question ID: 0980928764)
A musician is exploring if there is a relationship between the number of practice hours and performance quality.
The results of the analysis are summarized in the following regression table.
| Characteristic | Beta | SE1 | p-value |
|---|---|---|---|
| Intercept | 2.9 | 0.409 | <0.001 |
| Practice Hours | 0.82 | 0.033 | <0.001 |
| No. Obs. = 52; Sigma = 1.53; R² = 0.924 | |||
| 1 SE = Standard Error | |||
The mean practice hours is 10.53, with a standard deviation of 6.46.
- What is the predicted performance quality if practice hours is 3.02?
- What is the value of the test statistic for testing \(H_0: \beta_1 = 0.87\)?
- Give a \(96\%\) confidence interval for \(\beta_0\).
Lower Bound: Upper Bound:
- Give a \(96\%\) confidence interval for \(\beta_1\)
Lower Bound: Upper Bound:
- Give a \(96\%\) confidence interval for the expected performance quality, if the practice hours is 6.96.
Lower Bound: Upper Bound:
- Give a \(96\%\) prediction interval for the performance quality, if the practice hours is 6.96.
Lower Bound: Upper Bound:
(Question ID: 0181606035)
A city planner is examining the relationship between the distance from the city center and housing price.
The results of the analysis are summarized in the following regression table.
| Characteristic | Beta | SE1 | p-value |
|---|---|---|---|
| Intercept | 496,923 | 6,959 | <0.001 |
| Distance From City Center | -4,962 | 570 | <0.001 |
| No. Obs. = 97; Sigma = 30,157; R² = 0.444 | |||
| 1 SE = Standard Error | |||
The mean distance from city center is 10.96, with a standard deviation of 5.4.
- What is the predicted housing price if distance from city center is 8.14?
- What is the value of the test statistic for testing \(H_0: \beta_1 = -3508.5\)?
- Give an \(80\%\) confidence interval for \(\beta_0\).
Lower Bound: Upper Bound:
- Give an \(80\%\) confidence interval for \(\beta_1\)
Lower Bound: Upper Bound:
- Give an \(80\%\) confidence interval for the expected housing price, if the distance from city center is 16.68.
Lower Bound: Upper Bound:
- Give an \(80\%\) prediction interval for the housing price, if the distance from city center is 16.68.
Lower Bound: Upper Bound:
(Question ID: 0744900941)
A social scientist is studying the relationship between the number of social media followers and perceived popularity.
The results of the analysis are summarized in the following regression table.
| Characteristic | Beta | SE1 | p-value |
|---|---|---|---|
| Intercept | 2.2 | 0.237 | <0.001 |
| Number Of Followers | 0.00 | 0.000 | 0.10 |
| No. Obs. = 42; Sigma = 0.752; R² = 0.066 | |||
| 1 SE = Standard Error | |||
The mean number of followers is 4.75963^{4}, with a standard deviation of 2.704879^{4}.
- What is the predicted perceived popularity if number of followers is 8.216846^{4}?
- What is the value of the test statistic for testing \(H_0: \beta_1 = 0\)?
- Give a \(92\%\) confidence interval for \(\beta_0\).
Lower Bound: Upper Bound:
- Give a \(92\%\) confidence interval for \(\beta_1\)
Lower Bound: Upper Bound:
- Give a \(92\%\) confidence interval for the expected perceived popularity, if the number of followers is 5.914149^{4}.
Lower Bound: Upper Bound:
- Give a \(92\%\) prediction interval for the perceived popularity, if the number of followers is 5.914149^{4}.
Lower Bound: Upper Bound:
(Question ID: 0126941118)
A store owner wants to use linear regression to understand the relationship between a diamond’s cost and the number of carats it is.
The results of the analysis are summarized in the following regression table.
| Characteristic | Beta | SE1 | p-value |
|---|---|---|---|
| Intercept | -2,404 | 382 | <0.001 |
| Carat | 7,783 | 136 | <0.001 |
| No. Obs. = 70; Sigma = 1,522; R² = 0.980 | |||
| 1 SE = Standard Error | |||
The mean carat is 2.48, with a standard deviation of 1.35.
- What is the predicted cost if carat is 4.13?
- What is the value of the test statistic for testing \(H_0: \beta_1 = 7255.32\)?
- Give a \(95\%\) confidence interval for \(\beta_0\).
Lower Bound: Upper Bound:
- Give a \(95\%\) confidence interval for \(\beta_1\)
Lower Bound: Upper Bound:
- Give a \(95\%\) confidence interval for the expected cost, if the carat is 1.62.
Lower Bound: Upper Bound:
- Give a \(95\%\) prediction interval for the cost, if the carat is 1.62.
Lower Bound: Upper Bound:
(Question ID: 0201812193)
A software engineer is analyzing if the number of lines of code affects the number of bugs.
The results of the analysis are summarized in the following regression table.
| Characteristic | Beta | SE1 | p-value |
|---|---|---|---|
| Intercept | 1.5 | 0.790 | 0.054 |
| Lines Of Code | 0.01 | 0.000 | <0.001 |
| No. Obs. = 89; Sigma = 3.24; R² = 0.940 | |||
| 1 SE = Standard Error | |||
The mean lines of code is 2604.25, with a standard deviation of 1262.33.
- What is the predicted number of bugs if lines of code is 3548.03?
- What is the value of the test statistic for testing \(H_0: \beta_1 = 0.01\)?
- Give a \(92\%\) confidence interval for \(\beta_0\).
Lower Bound: Upper Bound:
- Give a \(92\%\) confidence interval for \(\beta_1\)
Lower Bound: Upper Bound:
- Give a \(92\%\) confidence interval for the expected number of bugs, if the lines of code is 3324.92.
Lower Bound: Upper Bound:
- Give a \(92\%\) prediction interval for the number of bugs, if the lines of code is 3324.92.
Lower Bound: Upper Bound:
(Question ID: 0868563736)
A software engineer is analyzing if the number of lines of code affects the number of bugs.
The results of the analysis are summarized in the following regression table.
| Characteristic | Beta | SE1 | p-value |
|---|---|---|---|
| Intercept | 2.7 | 0.710 | <0.001 |
| Lines Of Code | 0.01 | 0.000 | <0.001 |
| No. Obs. = 75; Sigma = 2.97; R² = 0.958 | |||
| 1 SE = Standard Error | |||
The mean lines of code is 2564.11, with a standard deviation of 1421.86.
- What is the predicted number of bugs if lines of code is 2332.3?
- What is the value of the test statistic for testing \(H_0: \beta_1 = 0.01\)?
- Give a \(90\%\) confidence interval for \(\beta_0\).
Lower Bound: Upper Bound:
- Give a \(90\%\) confidence interval for \(\beta_1\)
Lower Bound: Upper Bound:
- Give a \(90\%\) confidence interval for the expected number of bugs, if the lines of code is 1749.93.
Lower Bound: Upper Bound:
- Give a \(90\%\) prediction interval for the number of bugs, if the lines of code is 1749.93.
Lower Bound: Upper Bound:
(Question ID: 0585541980)
A coffee shop owner wants to see if there’s a relationship between the temperature of a latte and customer satisfaction.
The results of the analysis are summarized in the following regression table.
| Characteristic | Beta | SE1 | p-value |
|---|---|---|---|
| Intercept | 1.3 | 3.27 | 0.7 |
| Latte Temperature | 0.02 | 0.021 | 0.3 |
| No. Obs. = 57; Sigma = 1.48; R² = 0.021 | |||
| 1 SE = Standard Error | |||
The mean latte temperature is 153.68, with a standard deviation of 9.32.
- What is the predicted customer satisfaction if latte temperature is 148.07?
- What is the value of the test statistic for testing \(H_0: \beta_1 = -0.02\)?
- Give a \(93\%\) confidence interval for \(\beta_0\).
Lower Bound: Upper Bound:
- Give a \(93\%\) confidence interval for \(\beta_1\)
Lower Bound: Upper Bound:
- Give a \(93\%\) confidence interval for the expected customer satisfaction, if the latte temperature is 155.66.
Lower Bound: Upper Bound:
- Give a \(93\%\) prediction interval for the customer satisfaction, if the latte temperature is 155.66.
Lower Bound: Upper Bound:
(Question ID: 0149799355)
A farmer is looking at the relationship between rainfall and crop yield.
The results of the analysis are summarized in the following regression table.
| Characteristic | Beta | SE1 | p-value |
|---|---|---|---|
| Intercept | 30 | 2.64 | <0.001 |
| Rainfall | 0.62 | 0.040 | <0.001 |
| No. Obs. = 39; Sigma = 7.11; R² = 0.866 | |||
| 1 SE = Standard Error | |||
The mean rainfall is 59.82, with a standard deviation of 28.97.
- What is the predicted crop yield if rainfall is 15.18?
- What is the value of the test statistic for testing \(H_0: \beta_1 = 0.52\)?
- Give a \(96\%\) confidence interval for \(\beta_0\).
Lower Bound: Upper Bound:
- Give a \(96\%\) confidence interval for \(\beta_1\)
Lower Bound: Upper Bound:
- Give a \(96\%\) confidence interval for the expected crop yield, if the rainfall is 49.87.
Lower Bound: Upper Bound:
- Give a \(96\%\) prediction interval for the crop yield, if the rainfall is 49.87.
Lower Bound: Upper Bound:
(Question ID: 0749788330)
An economist wants to see if there’s a relationship between a country’s GDP and its average life expectancy.
The results of the analysis are summarized in the following regression table.
| Characteristic | Beta | SE1 | p-value |
|---|---|---|---|
| Intercept | 65 | 0.432 | <0.001 |
| Gdp | 0.00 | 0.000 | <0.001 |
| No. Obs. = 88; Sigma = 1.87; R² = 0.639 | |||
| 1 SE = Standard Error | |||
The mean GDP is 5.116727^{4}, with a standard deviation of 2.672936^{4}.
- What is the predicted life expectancy if GDP is 4.009916^{4}?
- What is the value of the test statistic for testing \(H_0: \beta_1 = 0\)?
- Give an \(88\%\) confidence interval for \(\beta_0\).
Lower Bound: Upper Bound:
- Give an \(88\%\) confidence interval for \(\beta_1\)
Lower Bound: Upper Bound:
- Give an \(88\%\) confidence interval for the expected life expectancy, if the GDP is 2.373881^{4}.
Lower Bound: Upper Bound:
- Give an \(88\%\) prediction interval for the life expectancy, if the GDP is 2.373881^{4}.
Lower Bound: Upper Bound:
(Question ID: 0681841237)
A marketing team is exploring the relationship between the amount spent on advertising and product sales.
The results of the analysis are summarized in the following regression table.
| Characteristic | Beta | SE1 | p-value |
|---|---|---|---|
| Intercept | 104 | 6.97 | <0.001 |
| Advertising Spend | 2.5 | 0.024 | <0.001 |
| No. Obs. = 48; Sigma = 20.3; R² = 0.996 | |||
| 1 SE = Standard Error | |||
The mean advertising spend is 263.88, with a standard deviation of 123.13.
- What is the predicted product sales if advertising spend is 238.16?
- What is the value of the test statistic for testing \(H_0: \beta_1 = 2.58\)?
- Give a \(94\%\) confidence interval for \(\beta_0\).
Lower Bound: Upper Bound:
- Give a \(94\%\) confidence interval for \(\beta_1\)
Lower Bound: Upper Bound:
- Give a \(94\%\) confidence interval for the expected product sales, if the advertising spend is 231.06.
Lower Bound: Upper Bound:
- Give a \(94\%\) prediction interval for the product sales, if the advertising spend is 231.06.
Lower Bound: Upper Bound:
(Question ID: 0854350877)
A software engineer is analyzing if the number of lines of code affects the number of bugs.
The results of the analysis are summarized in the following regression table.
| Characteristic | Beta | SE1 | p-value |
|---|---|---|---|
| Intercept | 3.1 | 0.636 | <0.001 |
| Lines Of Code | 0.01 | 0.000 | <0.001 |
| No. Obs. = 76; Sigma = 2.79; R² = 0.950 | |||
| 1 SE = Standard Error | |||
The mean lines of code is 2122.86, with a standard deviation of 1246.02.
- What is the predicted number of bugs if lines of code is 1613.42?
- What is the value of the test statistic for testing \(H_0: \beta_1 = 0.01\)?
- Give a \(92\%\) confidence interval for \(\beta_0\).
Lower Bound: Upper Bound:
- Give a \(92\%\) confidence interval for \(\beta_1\)
Lower Bound: Upper Bound:
- Give a \(92\%\) confidence interval for the expected number of bugs, if the lines of code is 3298.11.
Lower Bound: Upper Bound:
- Give a \(92\%\) prediction interval for the number of bugs, if the lines of code is 3298.11.
Lower Bound: Upper Bound:
(Question ID: 0148759846)
A coffee shop owner wants to see if there’s a relationship between the temperature of a latte and customer satisfaction.
The results of the analysis are summarized in the following regression table.
| Characteristic | Beta | SE1 | p-value |
|---|---|---|---|
| Intercept | 0.27 | 2.49 | >0.9 |
| Latte Temperature | 0.03 | 0.016 | 0.071 |
| No. Obs. = 67; Sigma = 1.10; R² = 0.049 | |||
| 1 SE = Standard Error | |||
The mean latte temperature is 154.25, with a standard deviation of 8.4.
- What is the predicted customer satisfaction if latte temperature is 145.24?
- What is the value of the test statistic for testing \(H_0: \beta_1 = 0.04\)?
- Give a \(94\%\) confidence interval for \(\beta_0\).
Lower Bound: Upper Bound:
- Give a \(94\%\) confidence interval for \(\beta_1\)
Lower Bound: Upper Bound:
- Give a \(94\%\) confidence interval for the expected customer satisfaction, if the latte temperature is 169.32.
Lower Bound: Upper Bound:
- Give a \(94\%\) prediction interval for the customer satisfaction, if the latte temperature is 169.32.
Lower Bound: Upper Bound:
(Question ID: 0882802243)
A software engineer is analyzing if the number of lines of code affects the number of bugs.
The results of the analysis are summarized in the following regression table.
| Characteristic | Beta | SE1 | p-value |
|---|---|---|---|
| Intercept | 1.9 | 0.790 | 0.020 |
| Lines Of Code | 0.01 | 0.000 | <0.001 |
| No. Obs. = 50; Sigma = 2.57; R² = 0.964 | |||
| 1 SE = Standard Error | |||
The mean lines of code is 2469.12, with a standard deviation of 1291.7.
- What is the predicted number of bugs if lines of code is 4608.23?
- What is the value of the test statistic for testing \(H_0: \beta_1 = 0.01\)?
- Give an \(83\%\) confidence interval for \(\beta_0\).
Lower Bound: Upper Bound:
- Give an \(83\%\) confidence interval for \(\beta_1\)
Lower Bound: Upper Bound:
- Give an \(83\%\) confidence interval for the expected number of bugs, if the lines of code is 1847.41.
Lower Bound: Upper Bound:
- Give an \(83\%\) prediction interval for the number of bugs, if the lines of code is 1847.41.
Lower Bound: Upper Bound:
(Question ID: 0842638545)
A marketing team is exploring the relationship between the amount spent on advertising and product sales.
The results of the analysis are summarized in the following regression table.
| Characteristic | Beta | SE1 | p-value |
|---|---|---|---|
| Intercept | 100 | 6.22 | <0.001 |
| Advertising Spend | 2.5 | 0.019 | <0.001 |
| No. Obs. = 58; Sigma = 19.0; R² = 0.997 | |||
| 1 SE = Standard Error | |||
The mean advertising spend is 298.94, with a standard deviation of 132.23.
- What is the predicted product sales if advertising spend is 256.8?
- What is the value of the test statistic for testing \(H_0: \beta_1 = 2.46\)?
- Give an \(80\%\) confidence interval for \(\beta_0\).
Lower Bound: Upper Bound:
- Give an \(80\%\) confidence interval for \(\beta_1\)
Lower Bound: Upper Bound:
- Give an \(80\%\) confidence interval for the expected product sales, if the advertising spend is 82.72.
Lower Bound: Upper Bound:
- Give an \(80\%\) prediction interval for the product sales, if the advertising spend is 82.72.
Lower Bound: Upper Bound:
(Question ID: 0337970387)
A marketing team is exploring the relationship between the amount spent on advertising and product sales.
The results of the analysis are summarized in the following regression table.
| Characteristic | Beta | SE1 | p-value |
|---|---|---|---|
| Intercept | 100 | 5.30 | <0.001 |
| Advertising Spend | 2.5 | 0.017 | <0.001 |
| No. Obs. = 84; Sigma = 20.8; R² = 0.996 | |||
| 1 SE = Standard Error | |||
The mean advertising spend is 277.87, with a standard deviation of 132.35.
- What is the predicted product sales if advertising spend is 339.05?
- What is the value of the test statistic for testing \(H_0: \beta_1 = 2.5\)?
- Give a \(93\%\) confidence interval for \(\beta_0\).
Lower Bound: Upper Bound:
- Give a \(93\%\) confidence interval for \(\beta_1\)
Lower Bound: Upper Bound:
- Give a \(93\%\) confidence interval for the expected product sales, if the advertising spend is 365.24.
Lower Bound: Upper Bound:
- Give a \(93\%\) prediction interval for the product sales, if the advertising spend is 365.24.
Lower Bound: Upper Bound:
(Question ID: 0007828796)
A store owner wants to use linear regression to understand the relationship between a diamond’s cost and the number of carats it is.
The results of the analysis are summarized in the following regression table.
| Characteristic | Beta | SE1 | p-value |
|---|---|---|---|
| Intercept | -2,128 | 386 | <0.001 |
| Carat | 7,659 | 134 | <0.001 |
| No. Obs. = 62; Sigma = 1,557; R² = 0.982 | |||
| 1 SE = Standard Error | |||
The mean carat is 2.48, with a standard deviation of 1.49.
- What is the predicted cost if carat is 2.89?
- What is the value of the test statistic for testing \(H_0: \beta_1 = 8010.08\)?
- Give an \(85\%\) confidence interval for \(\beta_0\).
Lower Bound: Upper Bound:
- Give an \(85\%\) confidence interval for \(\beta_1\)
Lower Bound: Upper Bound:
- Give an \(85\%\) confidence interval for the expected cost, if the carat is 4.16.
Lower Bound: Upper Bound:
- Give an \(85\%\) prediction interval for the cost, if the carat is 4.16.
Lower Bound: Upper Bound:
(Question ID: 0185469239)
A coffee shop owner wants to see if there’s a relationship between the temperature of a latte and customer satisfaction.
The results of the analysis are summarized in the following regression table.
| Characteristic | Beta | SE1 | p-value |
|---|---|---|---|
| Intercept | 1.1 | 2.98 | 0.7 |
| Latte Temperature | 0.03 | 0.019 | 0.2 |
| No. Obs. = 50; Sigma = 1.20; R² = 0.037 | |||
| 1 SE = Standard Error | |||
The mean latte temperature is 156.02, with a standard deviation of 9.01.
- What is the predicted customer satisfaction if latte temperature is 160.43?
- What is the value of the test statistic for testing \(H_0: \beta_1 = -0.02\)?
- Give an \(87\%\) confidence interval for \(\beta_0\).
Lower Bound: Upper Bound:
- Give an \(87\%\) confidence interval for \(\beta_1\)
Lower Bound: Upper Bound:
- Give an \(87\%\) confidence interval for the expected customer satisfaction, if the latte temperature is 150.27.
Lower Bound: Upper Bound:
- Give an \(87\%\) prediction interval for the customer satisfaction, if the latte temperature is 150.27.
Lower Bound: Upper Bound:
(Question ID: 0158499388)
A software engineer is analyzing if the number of lines of code affects the number of bugs.
The results of the analysis are summarized in the following regression table.
| Characteristic | Beta | SE1 | p-value |
|---|---|---|---|
| Intercept | 2.7 | 0.846 | 0.003 |
| Lines Of Code | 0.01 | 0.000 | <0.001 |
| No. Obs. = 62; Sigma = 2.85; R² = 0.950 | |||
| 1 SE = Standard Error | |||
The mean lines of code is 2680.12, with a standard deviation of 1280.5.
- What is the predicted number of bugs if lines of code is 3789.81?
- What is the value of the test statistic for testing \(H_0: \beta_1 = 0.01\)?
- Give an \(82\%\) confidence interval for \(\beta_0\).
Lower Bound: Upper Bound:
- Give an \(82\%\) confidence interval for \(\beta_1\)
Lower Bound: Upper Bound:
- Give an \(82\%\) confidence interval for the expected number of bugs, if the lines of code is 1883.02.
Lower Bound: Upper Bound:
- Give an \(82\%\) prediction interval for the number of bugs, if the lines of code is 1883.02.
Lower Bound: Upper Bound:
(Question ID: 0280518894)
A store owner wants to use linear regression to understand the relationship between a diamond’s cost and the number of carats it is.
The results of the analysis are summarized in the following regression table.
| Characteristic | Beta | SE1 | p-value |
|---|---|---|---|
| Intercept | -1,693 | 337 | <0.001 |
| Carat | 7,723 | 109 | <0.001 |
| No. Obs. = 85; Sigma = 1,465; R² = 0.984 | |||
| 1 SE = Standard Error | |||
The mean carat is 2.72, with a standard deviation of 1.46.
- What is the predicted cost if carat is 0.76?
- What is the value of the test statistic for testing \(H_0: \beta_1 = 7948.63\)?
- Give a \(99\%\) confidence interval for \(\beta_0\).
Lower Bound: Upper Bound:
- Give a \(99\%\) confidence interval for \(\beta_1\)
Lower Bound: Upper Bound:
- Give a \(99\%\) confidence interval for the expected cost, if the carat is 2.41.
Lower Bound: Upper Bound:
- Give a \(99\%\) prediction interval for the cost, if the carat is 2.41.
Lower Bound: Upper Bound:
(Question ID: 0322738723)
A car manufacturer is looking at the relationship between engine size and fuel efficiency.
The results of the analysis are summarized in the following regression table.
| Characteristic | Beta | SE1 | p-value |
|---|---|---|---|
| Intercept | 39 | 1.21 | <0.001 |
| Engine Size | -4.6 | 0.451 | <0.001 |
| No. Obs. = 67; Sigma = 3.15; R² = 0.616 | |||
| 1 SE = Standard Error | |||
The mean engine size is 2.54, with a standard deviation of 0.86.
- What is the predicted fuel efficiency if engine size is 1.46?
- What is the value of the test statistic for testing \(H_0: \beta_1 = -4.1\)?
- Give an \(80\%\) confidence interval for \(\beta_0\).
Lower Bound: Upper Bound:
- Give an \(80\%\) confidence interval for \(\beta_1\)
Lower Bound: Upper Bound:
- Give an \(80\%\) confidence interval for the expected fuel efficiency, if the engine size is 2.03.
Lower Bound: Upper Bound:
- Give an \(80\%\) prediction interval for the fuel efficiency, if the engine size is 2.03.
Lower Bound: Upper Bound:
(Question ID: 0908839906)
A teacher is examining if the number of hours studied affects a student’s exam score.
The results of the analysis are summarized in the following regression table.
| Characteristic | Beta | SE1 | p-value |
|---|---|---|---|
| Intercept | 37 | 2.20 | <0.001 |
| Study Hours | 7.0 | 0.232 | <0.001 |
| No. Obs. = 60; Sigma = 7.91; R² = 0.941 | |||
| 1 SE = Standard Error | |||
The mean study hours is 8.41, with a standard deviation of 4.44.
- What is the predicted exam score if study hours is 12.33?
- What is the value of the test statistic for testing \(H_0: \beta_1 = 7.23\)?
- Give an \(87\%\) confidence interval for \(\beta_0\).
Lower Bound: Upper Bound:
- Give an \(87\%\) confidence interval for \(\beta_1\)
Lower Bound: Upper Bound:
- Give an \(87\%\) confidence interval for the expected exam score, if the study hours is 2.65.
Lower Bound: Upper Bound:
- Give an \(87\%\) prediction interval for the exam score, if the study hours is 2.65.
Lower Bound: Upper Bound:
(Question ID: 0076602824)
A student is investigating if there is a relationship between the number of siblings and their grade point average.
The results of the analysis are summarized in the following regression table.
| Characteristic | Beta | SE1 | p-value |
|---|---|---|---|
| Intercept | 3.0 | 0.100 | <0.001 |
| Number Of Siblings | 0.03 | 0.033 | 0.3 |
| No. Obs. = 84; Sigma = 0.439; R² = 0.013 | |||
| 1 SE = Standard Error | |||
The mean number of siblings is 2.64, with a standard deviation of 1.45.
- What is the predicted grade point average if number of siblings is 4.9?
- What is the value of the test statistic for testing \(H_0: \beta_1 = 0.03\)?
- Give a \(93\%\) confidence interval for \(\beta_0\).
Lower Bound: Upper Bound:
- Give a \(93\%\) confidence interval for \(\beta_1\)
Lower Bound: Upper Bound:
- Give a \(93\%\) confidence interval for the expected grade point average, if the number of siblings is 0.17.
Lower Bound: Upper Bound:
- Give a \(93\%\) prediction interval for the grade point average, if the number of siblings is 0.17.
Lower Bound: Upper Bound:
(Question ID: 0700229226)
A researcher is studying if there is a link between the amount of fertilizer used and the yield of corn.
The results of the analysis are summarized in the following regression table.
| Characteristic | Beta | SE1 | p-value |
|---|---|---|---|
| Intercept | 47 | 0.887 | <0.001 |
| Fertilizer Amount | 0.82 | 0.007 | <0.001 |
| No. Obs. = 85; Sigma = 4.37; R² = 0.993 | |||
| 1 SE = Standard Error | |||
The mean fertilizer amount is 101.36, with a standard deviation of 64.39.
- What is the predicted corn yield if fertilizer amount is 107.74?
- What is the value of the test statistic for testing \(H_0: \beta_1 = 0.84\)?
- Give an \(87\%\) confidence interval for \(\beta_0\).
Lower Bound: Upper Bound:
- Give an \(87\%\) confidence interval for \(\beta_1\)
Lower Bound: Upper Bound:
- Give an \(87\%\) confidence interval for the expected corn yield, if the fertilizer amount is 176.06.
Lower Bound: Upper Bound:
- Give an \(87\%\) prediction interval for the corn yield, if the fertilizer amount is 176.06.
Lower Bound: Upper Bound:
(Question ID: 0078796850)
An economist wants to see if there’s a relationship between a country’s GDP and its average life expectancy.
The results of the analysis are summarized in the following regression table.
| Characteristic | Beta | SE1 | p-value |
|---|---|---|---|
| Intercept | 65 | 0.572 | <0.001 |
| Gdp | 0.00 | 0.000 | <0.001 |
| No. Obs. = 59; Sigma = 2.03; R² = 0.609 | |||
| 1 SE = Standard Error | |||
The mean GDP is 5.24373^{4}, with a standard deviation of 2.754493^{4}.
- What is the predicted life expectancy if GDP is 7.844519^{4}?
- What is the value of the test statistic for testing \(H_0: \beta_1 = 0\)?
- Give an \(89\%\) confidence interval for \(\beta_0\).
Lower Bound: Upper Bound:
- Give an \(89\%\) confidence interval for \(\beta_1\)
Lower Bound: Upper Bound:
- Give an \(89\%\) confidence interval for the expected life expectancy, if the GDP is 9.514658^{4}.
Lower Bound: Upper Bound:
- Give an \(89\%\) prediction interval for the life expectancy, if the GDP is 9.514658^{4}.
Lower Bound: Upper Bound:
(Question ID: 0103018241)
A car manufacturer is looking at the relationship between engine size and fuel efficiency.
The results of the analysis are summarized in the following regression table.
| Characteristic | Beta | SE1 | p-value |
|---|---|---|---|
| Intercept | 40 | 1.29 | <0.001 |
| Engine Size | -5.0 | 0.468 | <0.001 |
| No. Obs. = 52; Sigma = 2.84; R² = 0.696 | |||
| 1 SE = Standard Error | |||
The mean engine size is 2.62, with a standard deviation of 0.85.
- What is the predicted fuel efficiency if engine size is 3.25?
- What is the value of the test statistic for testing \(H_0: \beta_1 = -5.61\)?
- Give an \(83\%\) confidence interval for \(\beta_0\).
Lower Bound: Upper Bound:
- Give an \(83\%\) confidence interval for \(\beta_1\)
Lower Bound: Upper Bound:
- Give an \(83\%\) confidence interval for the expected fuel efficiency, if the engine size is 2.49.
Lower Bound: Upper Bound:
- Give an \(83\%\) prediction interval for the fuel efficiency, if the engine size is 2.49.
Lower Bound: Upper Bound:
(Question ID: 0235480666)
A farmer is looking at the relationship between rainfall and crop yield.
The results of the analysis are summarized in the following regression table.
| Characteristic | Beta | SE1 | p-value |
|---|---|---|---|
| Intercept | 30 | 1.97 | <0.001 |
| Rainfall | 0.60 | 0.032 | <0.001 |
| No. Obs. = 85; Sigma = 7.46; R² = 0.805 | |||
| 1 SE = Standard Error | |||
The mean rainfall is 55.44, with a standard deviation of 25.08.
- What is the predicted crop yield if rainfall is 99.75?
- What is the value of the test statistic for testing \(H_0: \beta_1 = 0.52\)?
- Give a \(92\%\) confidence interval for \(\beta_0\).
Lower Bound: Upper Bound:
- Give a \(92\%\) confidence interval for \(\beta_1\)
Lower Bound: Upper Bound:
- Give a \(92\%\) confidence interval for the expected crop yield, if the rainfall is 66.74.
Lower Bound: Upper Bound:
- Give a \(92\%\) prediction interval for the crop yield, if the rainfall is 66.74.
Lower Bound: Upper Bound:
(Question ID: 0026468866)
A scientist is investigating if there is a relationship between the temperature of a reaction and its rate.
The results of the analysis are summarized in the following regression table.
| Characteristic | Beta | SE1 | p-value |
|---|---|---|---|
| Intercept | 0.07 | 0.019 | <0.001 |
| Temperature | 0.02 | 0.000 | <0.001 |
| No. Obs. = 94; Sigma = 0.050; R² = 0.973 | |||
| 1 SE = Standard Error | |||
The mean temperature is 50.3, with a standard deviation of 14.62.
- What is the predicted reaction rate if temperature is 69.82?
- What is the value of the test statistic for testing \(H_0: \beta_1 = 0.02\)?
- Give an \(80\%\) confidence interval for \(\beta_0\).
Lower Bound: Upper Bound:
- Give an \(80\%\) confidence interval for \(\beta_1\)
Lower Bound: Upper Bound:
- Give an \(80\%\) confidence interval for the expected reaction rate, if the temperature is 40.65.
Lower Bound: Upper Bound:
- Give an \(80\%\) prediction interval for the reaction rate, if the temperature is 40.65.
Lower Bound: Upper Bound:
(Question ID: 0123028380)
A marketing team is exploring the relationship between the amount spent on advertising and product sales.
The results of the analysis are summarized in the following regression table.
| Characteristic | Beta | SE1 | p-value |
|---|---|---|---|
| Intercept | 99 | 5.93 | <0.001 |
| Advertising Spend | 2.5 | 0.018 | <0.001 |
| No. Obs. = 82; Sigma = 20.2; R² = 0.996 | |||
| 1 SE = Standard Error | |||
The mean advertising spend is 301.63, with a standard deviation of 123.25.
- What is the predicted product sales if advertising spend is 347.51?
- What is the value of the test statistic for testing \(H_0: \beta_1 = 2.45\)?
- Give a \(96\%\) confidence interval for \(\beta_0\).
Lower Bound: Upper Bound:
- Give a \(96\%\) confidence interval for \(\beta_1\)
Lower Bound: Upper Bound:
- Give a \(96\%\) confidence interval for the expected product sales, if the advertising spend is 245.81.
Lower Bound: Upper Bound:
- Give a \(96\%\) prediction interval for the product sales, if the advertising spend is 245.81.
Lower Bound: Upper Bound:
(Question ID: 0337431477)
An economist wants to see if there’s a relationship between a country’s GDP and its average life expectancy.
The results of the analysis are summarized in the following regression table.
| Characteristic | Beta | SE1 | p-value |
|---|---|---|---|
| Intercept | 65 | 0.446 | <0.001 |
| Gdp | 0.00 | 0.000 | <0.001 |
| No. Obs. = 67; Sigma = 1.90; R² = 0.731 | |||
| 1 SE = Standard Error | |||
The mean GDP is 5.010035^{4}, with a standard deviation of 3.073833^{4}.
- What is the predicted life expectancy if GDP is 3584.62?
- What is the value of the test statistic for testing \(H_0: \beta_1 = 0\)?
- Give a \(98\%\) confidence interval for \(\beta_0\).
Lower Bound: Upper Bound:
- Give a \(98\%\) confidence interval for \(\beta_1\)
Lower Bound: Upper Bound:
- Give a \(98\%\) confidence interval for the expected life expectancy, if the GDP is 6886.4.
Lower Bound: Upper Bound:
- Give a \(98\%\) prediction interval for the life expectancy, if the GDP is 6886.4.
Lower Bound: Upper Bound:
(Question ID: 0497153336)
A store owner wants to use linear regression to understand the relationship between a diamond’s cost and the number of carats it is.
The results of the analysis are summarized in the following regression table.
| Characteristic | Beta | SE1 | p-value |
|---|---|---|---|
| Intercept | -2,456 | 368 | <0.001 |
| Carat | 7,790 | 125 | <0.001 |
| No. Obs. = 91; Sigma = 1,658; R² = 0.978 | |||
| 1 SE = Standard Error | |||
The mean carat is 2.6, with a standard deviation of 1.4.
- What is the predicted cost if carat is 4.87?
- What is the value of the test statistic for testing \(H_0: \beta_1 = 8036.25\)?
- Give a \(94\%\) confidence interval for \(\beta_0\).
Lower Bound: Upper Bound:
- Give a \(94\%\) confidence interval for \(\beta_1\)
Lower Bound: Upper Bound:
- Give a \(94\%\) confidence interval for the expected cost, if the carat is 1.31.
Lower Bound: Upper Bound:
- Give a \(94\%\) prediction interval for the cost, if the carat is 1.31.
Lower Bound: Upper Bound:
(Question ID: 0967831107)
A farmer is looking at the relationship between rainfall and crop yield.
The results of the analysis are summarized in the following regression table.
| Characteristic | Beta | SE1 | p-value |
|---|---|---|---|
| Intercept | 34 | 2.54 | <0.001 |
| Rainfall | 0.56 | 0.037 | <0.001 |
| No. Obs. = 37; Sigma = 6.53; R² = 0.872 | |||
| 1 SE = Standard Error | |||
The mean rainfall is 63.01, with a standard deviation of 29.78.
- What is the predicted crop yield if rainfall is 44.74?
- What is the value of the test statistic for testing \(H_0: \beta_1 = 0.65\)?
- Give a \(94\%\) confidence interval for \(\beta_0\).
Lower Bound: Upper Bound:
- Give a \(94\%\) confidence interval for \(\beta_1\)
Lower Bound: Upper Bound:
- Give a \(94\%\) confidence interval for the expected crop yield, if the rainfall is 38.3.
Lower Bound: Upper Bound:
- Give a \(94\%\) prediction interval for the crop yield, if the rainfall is 38.3.
Lower Bound: Upper Bound:
(Question ID: 0120635343)
A city planner is examining the relationship between the distance from the city center and housing price.
The results of the analysis are summarized in the following regression table.
| Characteristic | Beta | SE1 | p-value |
|---|---|---|---|
| Intercept | 512,898 | 10,918 | <0.001 |
| Distance From City Center | -5,815 | 842 | <0.001 |
| No. Obs. = 45; Sigma = 27,982; R² = 0.526 | |||
| 1 SE = Standard Error | |||
The mean distance from city center is 11.98, with a standard deviation of 5.01.
- What is the predicted housing price if distance from city center is 17.81?
- What is the value of the test statistic for testing \(H_0: \beta_1 = -8787.26\)?
- Give a \(95\%\) confidence interval for \(\beta_0\).
Lower Bound: Upper Bound:
- Give a \(95\%\) confidence interval for \(\beta_1\)
Lower Bound: Upper Bound:
- Give a \(95\%\) confidence interval for the expected housing price, if the distance from city center is 3.54.
Lower Bound: Upper Bound:
- Give a \(95\%\) prediction interval for the housing price, if the distance from city center is 3.54.
Lower Bound: Upper Bound:
(Question ID: 0050372076)
A coffee shop owner wants to see if there’s a relationship between the temperature of a latte and customer satisfaction.
The results of the analysis are summarized in the following regression table.
| Characteristic | Beta | SE1 | p-value |
|---|---|---|---|
| Intercept | 10 | 3.32 | 0.004 |
| Latte Temperature | -0.03 | 0.022 | 0.14 |
| No. Obs. = 40; Sigma = 1.06; R² = 0.056 | |||
| 1 SE = Standard Error | |||
The mean latte temperature is 153.52, with a standard deviation of 7.87.
- What is the predicted customer satisfaction if latte temperature is 149.38?
- What is the value of the test statistic for testing \(H_0: \beta_1 = 0.02\)?
- Give a \(91\%\) confidence interval for \(\beta_0\).
Lower Bound: Upper Bound:
- Give a \(91\%\) confidence interval for \(\beta_1\)
Lower Bound: Upper Bound:
- Give a \(91\%\) confidence interval for the expected customer satisfaction, if the latte temperature is 153.71.
Lower Bound: Upper Bound:
- Give a \(91\%\) prediction interval for the customer satisfaction, if the latte temperature is 153.71.
Lower Bound: Upper Bound:
(Question ID: 0987398128)
A student is investigating if there is a relationship between the number of siblings and their grade point average.
The results of the analysis are summarized in the following regression table.
| Characteristic | Beta | SE1 | p-value |
|---|---|---|---|
| Intercept | 3.0 | 0.080 | <0.001 |
| Number Of Siblings | 0.01 | 0.031 | 0.8 |
| No. Obs. = 98; Sigma = 0.416; R² = 0.001 | |||
| 1 SE = Standard Error | |||
The mean number of siblings is 2.21, with a standard deviation of 1.38.
- What is the predicted grade point average if number of siblings is 3.87?
- What is the value of the test statistic for testing \(H_0: \beta_1 = 0.04\)?
- Give a \(99\%\) confidence interval for \(\beta_0\).
Lower Bound: Upper Bound:
- Give a \(99\%\) confidence interval for \(\beta_1\)
Lower Bound: Upper Bound:
- Give a \(99\%\) confidence interval for the expected grade point average, if the number of siblings is 1.43.
Lower Bound: Upper Bound:
- Give a \(99\%\) prediction interval for the grade point average, if the number of siblings is 1.43.
Lower Bound: Upper Bound:
(Question ID: 0682645574)
A store owner wants to use linear regression to understand the relationship between a diamond’s cost and the number of carats it is.
The results of the analysis are summarized in the following regression table.
| Characteristic | Beta | SE1 | p-value |
|---|---|---|---|
| Intercept | -2,130 | 496 | <0.001 |
| Carat | 7,726 | 168 | <0.001 |
| No. Obs. = 54; Sigma = 1,641; R² = 0.976 | |||
| 1 SE = Standard Error | |||
The mean carat is 2.64, with a standard deviation of 1.34.
- What is the predicted cost if carat is 0.71?
- What is the value of the test statistic for testing \(H_0: \beta_1 = 7678.96\)?
- Give a \(91\%\) confidence interval for \(\beta_0\).
Lower Bound: Upper Bound:
- Give a \(91\%\) confidence interval for \(\beta_1\)
Lower Bound: Upper Bound:
- Give a \(91\%\) confidence interval for the expected cost, if the carat is 0.67.
Lower Bound: Upper Bound:
- Give a \(91\%\) prediction interval for the cost, if the carat is 0.67.
Lower Bound: Upper Bound:
(Question ID: 0862484707)
A city planner is examining the relationship between the distance from the city center and housing price.
The results of the analysis are summarized in the following regression table.
| Characteristic | Beta | SE1 | p-value |
|---|---|---|---|
| Intercept | 493,768 | 8,262 | <0.001 |
| Distance From City Center | -4,151 | 641 | <0.001 |
| No. Obs. = 67; Sigma = 29,895; R² = 0.392 | |||
| 1 SE = Standard Error | |||
The mean distance from city center is 11.56, with a standard deviation of 5.74.
- What is the predicted housing price if distance from city center is 15.89?
- What is the value of the test statistic for testing \(H_0: \beta_1 = -5759.91\)?
- Give an \(89\%\) confidence interval for \(\beta_0\).
Lower Bound: Upper Bound:
- Give an \(89\%\) confidence interval for \(\beta_1\)
Lower Bound: Upper Bound:
- Give an \(89\%\) confidence interval for the expected housing price, if the distance from city center is 8.79.
Lower Bound: Upper Bound:
- Give an \(89\%\) prediction interval for the housing price, if the distance from city center is 8.79.
Lower Bound: Upper Bound:
(Question ID: 0308901703)
A fitness instructor is looking at the relationship between the number of push-ups a person can do and their cardiovascular health score.
The results of the analysis are summarized in the following regression table.
| Characteristic | Beta | SE1 | p-value |
|---|---|---|---|
| Intercept | 59 | 1.40 | <0.001 |
| Number Of Push-Ups | 0.56 | 0.045 | <0.001 |
| No. Obs. = 44; Sigma = 4.19; R² = 0.781 | |||
| 1 SE = Standard Error | |||
The mean number of push-ups is 27.52, with a standard deviation of 14.06.
- What is the predicted cardiovascular health score if number of push-ups is 12.13?
- What is the value of the test statistic for testing \(H_0: \beta_1 = 0.53\)?
- Give an \(81\%\) confidence interval for \(\beta_0\).
Lower Bound: Upper Bound:
- Give an \(81\%\) confidence interval for \(\beta_1\)
Lower Bound: Upper Bound:
- Give an \(81\%\) confidence interval for the expected cardiovascular health score, if the number of push-ups is 7.02.
Lower Bound: Upper Bound:
- Give an \(81\%\) prediction interval for the cardiovascular health score, if the number of push-ups is 7.02.
Lower Bound: Upper Bound:
(Question ID: 0001081575)
A car manufacturer is looking at the relationship between engine size and fuel efficiency.
The results of the analysis are summarized in the following regression table.
| Characteristic | Beta | SE1 | p-value |
|---|---|---|---|
| Intercept | 41 | 1.48 | <0.001 |
| Engine Size | -5.4 | 0.555 | <0.001 |
| No. Obs. = 52; Sigma = 3.64; R² = 0.652 | |||
| 1 SE = Standard Error | |||
The mean engine size is 2.51, with a standard deviation of 0.92.
- What is the predicted fuel efficiency if engine size is 1.06?
- What is the value of the test statistic for testing \(H_0: \beta_1 = -6.98\)?
- Give an \(83\%\) confidence interval for \(\beta_0\).
Lower Bound: Upper Bound:
- Give an \(83\%\) confidence interval for \(\beta_1\)
Lower Bound: Upper Bound:
- Give an \(83\%\) confidence interval for the expected fuel efficiency, if the engine size is 3.82.
Lower Bound: Upper Bound:
- Give an \(83\%\) prediction interval for the fuel efficiency, if the engine size is 3.82.
Lower Bound: Upper Bound:
(Question ID: 0120093666)
A city planner is examining the relationship between the distance from the city center and housing price.
The results of the analysis are summarized in the following regression table.
| Characteristic | Beta | SE1 | p-value |
|---|---|---|---|
| Intercept | 497,765 | 6,006 | <0.001 |
| Distance From City Center | -5,013 | 486 | <0.001 |
| No. Obs. = 99; Sigma = 24,978; R² = 0.523 | |||
| 1 SE = Standard Error | |||
The mean distance from city center is 11.23, with a standard deviation of 5.19.
- What is the predicted housing price if distance from city center is 13.63?
- What is the value of the test statistic for testing \(H_0: \beta_1 = -6495.3\)?
- Give a \(95\%\) confidence interval for \(\beta_0\).
Lower Bound: Upper Bound:
- Give a \(95\%\) confidence interval for \(\beta_1\)
Lower Bound: Upper Bound:
- Give a \(95\%\) confidence interval for the expected housing price, if the distance from city center is 13.81.
Lower Bound: Upper Bound:
- Give a \(95\%\) prediction interval for the housing price, if the distance from city center is 13.81.
Lower Bound: Upper Bound:
(Question ID: 0551821867)
A meteorologist is examining the relationship between air pressure and the probability of rain.
The results of the analysis are summarized in the following regression table.
| Characteristic | Beta | SE1 | p-value |
|---|---|---|---|
| Intercept | 0.34 | 0.736 | 0.6 |
| Air Pressure | 0.00 | 0.001 | >0.9 |
| No. Obs. = 98; Sigma = 0.107; R² = 0.000 | |||
| 1 SE = Standard Error | |||
The mean air pressure is 1004.29, with a standard deviation of 14.88.
- What is the predicted probability of rain if air pressure is 1005.32?
- What is the value of the test statistic for testing \(H_0: \beta_1 = 0\)?
- Give an \(80\%\) confidence interval for \(\beta_0\).
Lower Bound: Upper Bound:
- Give an \(80\%\) confidence interval for \(\beta_1\)
Lower Bound: Upper Bound:
- Give an \(80\%\) confidence interval for the expected probability of rain, if the air pressure is 994.59.
Lower Bound: Upper Bound:
- Give an \(80\%\) prediction interval for the probability of rain, if the air pressure is 994.59.
Lower Bound: Upper Bound:
(Question ID: 0236466359)
A store owner wants to use linear regression to understand the relationship between a diamond’s cost and the number of carats it is.
The results of the analysis are summarized in the following regression table.
| Characteristic | Beta | SE1 | p-value |
|---|---|---|---|
| Intercept | -2,019 | 355 | <0.001 |
| Carat | 7,544 | 123 | <0.001 |
| No. Obs. = 68; Sigma = 1,485; R² = 0.983 | |||
| 1 SE = Standard Error | |||
The mean carat is 2.49, with a standard deviation of 1.48.
- What is the predicted cost if carat is 0.35?
- What is the value of the test statistic for testing \(H_0: \beta_1 = 7122.11\)?
- Give a \(90\%\) confidence interval for \(\beta_0\).
Lower Bound: Upper Bound:
- Give a \(90\%\) confidence interval for \(\beta_1\)
Lower Bound: Upper Bound:
- Give a \(90\%\) confidence interval for the expected cost, if the carat is 3.01.
Lower Bound: Upper Bound:
- Give a \(90\%\) prediction interval for the cost, if the carat is 3.01.
Lower Bound: Upper Bound:
(Question ID: 0429520546)
A doctor is studying the association between a patient’s age and their cholesterol level.
The results of the analysis are summarized in the following regression table.
| Characteristic | Beta | SE1 | p-value |
|---|---|---|---|
| Intercept | 155 | 5.11 | <0.001 |
| Age | 1.1 | 0.093 | <0.001 |
| No. Obs. = 96; Sigma = 14.8; R² = 0.607 | |||
| 1 SE = Standard Error | |||
The mean age is 52.79, with a standard deviation of 16.42.
- What is the predicted cholesterol level if age is 53.54?
- What is the value of the test statistic for testing \(H_0: \beta_1 = 1.3\)?
- Give an \(80\%\) confidence interval for \(\beta_0\).
Lower Bound: Upper Bound:
- Give an \(80\%\) confidence interval for \(\beta_1\)
Lower Bound: Upper Bound:
- Give an \(80\%\) confidence interval for the expected cholesterol level, if the age is 35.7.
Lower Bound: Upper Bound:
- Give an \(80\%\) prediction interval for the cholesterol level, if the age is 35.7.
Lower Bound: Upper Bound:
(Question ID: 0350240593)
A farmer is looking at the relationship between rainfall and crop yield.
The results of the analysis are summarized in the following regression table.
| Characteristic | Beta | SE1 | p-value |
|---|---|---|---|
| Intercept | 28 | 2.25 | <0.001 |
| Rainfall | 0.61 | 0.039 | <0.001 |
| No. Obs. = 43; Sigma = 6.27; R² = 0.858 | |||
| 1 SE = Standard Error | |||
The mean rainfall is 52.17, with a standard deviation of 24.82.
- What is the predicted crop yield if rainfall is 22.65?
- What is the value of the test statistic for testing \(H_0: \beta_1 = 0.55\)?
- Give a \(91\%\) confidence interval for \(\beta_0\).
Lower Bound: Upper Bound:
- Give a \(91\%\) confidence interval for \(\beta_1\)
Lower Bound: Upper Bound:
- Give a \(91\%\) confidence interval for the expected crop yield, if the rainfall is 31.4.
Lower Bound: Upper Bound:
- Give a \(91\%\) prediction interval for the crop yield, if the rainfall is 31.4.
Lower Bound: Upper Bound:
(Question ID: 0879837019)
A store owner wants to use linear regression to understand the relationship between a diamond’s cost and the number of carats it is.
The results of the analysis are summarized in the following regression table.
| Characteristic | Beta | SE1 | p-value |
|---|---|---|---|
| Intercept | -2,037 | 333 | <0.001 |
| Carat | 7,702 | 104 | <0.001 |
| No. Obs. = 97; Sigma = 1,569; R² = 0.983 | |||
| 1 SE = Standard Error | |||
The mean carat is 2.82, with a standard deviation of 1.55.
- What is the predicted cost if carat is 1.05?
- What is the value of the test statistic for testing \(H_0: \beta_1 = 7660.4\)?
- Give a \(98\%\) confidence interval for \(\beta_0\).
Lower Bound: Upper Bound:
- Give a \(98\%\) confidence interval for \(\beta_1\)
Lower Bound: Upper Bound:
- Give a \(98\%\) confidence interval for the expected cost, if the carat is 3.95.
Lower Bound: Upper Bound:
- Give a \(98\%\) prediction interval for the cost, if the carat is 3.95.
Lower Bound: Upper Bound:
(Question ID: 0304633723)
A researcher is studying if there is a link between the amount of fertilizer used and the yield of corn.
The results of the analysis are summarized in the following regression table.
| Characteristic | Beta | SE1 | p-value |
|---|---|---|---|
| Intercept | 48 | 1.20 | <0.001 |
| Fertilizer Amount | 0.82 | 0.010 | <0.001 |
| No. Obs. = 85; Sigma = 4.97; R² = 0.988 | |||
| 1 SE = Standard Error | |||
The mean fertilizer amount is 109.67, with a standard deviation of 55.5.
- What is the predicted corn yield if fertilizer amount is 28.62?
- What is the value of the test statistic for testing \(H_0: \beta_1 = 0.83\)?
- Give an \(89\%\) confidence interval for \(\beta_0\).
Lower Bound: Upper Bound:
- Give an \(89\%\) confidence interval for \(\beta_1\)
Lower Bound: Upper Bound:
- Give an \(89\%\) confidence interval for the expected corn yield, if the fertilizer amount is 166.63.
Lower Bound: Upper Bound:
- Give an \(89\%\) prediction interval for the corn yield, if the fertilizer amount is 166.63.
Lower Bound: Upper Bound:
(Question ID: 0847571267)
A social scientist is studying the relationship between the number of social media followers and perceived popularity.
The results of the analysis are summarized in the following regression table.
| Characteristic | Beta | SE1 | p-value |
|---|---|---|---|
| Intercept | 1.8 | 0.257 | <0.001 |
| Number Of Followers | 0.00 | 0.000 | 0.025 |
| No. Obs. = 41; Sigma = 0.797; R² = 0.122 | |||
| 1 SE = Standard Error | |||
The mean number of followers is 5.015295^{4}, with a standard deviation of 2.808206^{4}.
- What is the predicted perceived popularity if number of followers is 6.857028^{4}?
- What is the value of the test statistic for testing \(H_0: \beta_1 = 0\)?
- Give a \(93\%\) confidence interval for \(\beta_0\).
Lower Bound: Upper Bound:
- Give a \(93\%\) confidence interval for \(\beta_1\)
Lower Bound: Upper Bound:
- Give a \(93\%\) confidence interval for the expected perceived popularity, if the number of followers is 6.39157^{4}.
Lower Bound: Upper Bound:
- Give a \(93\%\) prediction interval for the perceived popularity, if the number of followers is 6.39157^{4}.
Lower Bound: Upper Bound:
(Question ID: 0819434363)
A musician is exploring if there is a relationship between the number of practice hours and performance quality.
The results of the analysis are summarized in the following regression table.
| Characteristic | Beta | SE1 | p-value |
|---|---|---|---|
| Intercept | 3.2 | 0.382 | <0.001 |
| Practice Hours | 0.78 | 0.030 | <0.001 |
| No. Obs. = 60; Sigma = 1.39; R² = 0.918 | |||
| 1 SE = Standard Error | |||
The mean practice hours is 11.07, with a standard deviation of 5.94.
- What is the predicted performance quality if practice hours is 4.11?
- What is the value of the test statistic for testing \(H_0: \beta_1 = 0.82\)?
- Give a \(95\%\) confidence interval for \(\beta_0\).
Lower Bound: Upper Bound:
- Give a \(95\%\) confidence interval for \(\beta_1\)
Lower Bound: Upper Bound:
- Give a \(95\%\) confidence interval for the expected performance quality, if the practice hours is 16.32.
Lower Bound: Upper Bound:
- Give a \(95\%\) prediction interval for the performance quality, if the practice hours is 16.32.
Lower Bound: Upper Bound:
(Question ID: 0017173133)
A teacher is examining if the number of hours studied affects a student’s exam score.
The results of the analysis are summarized in the following regression table.
| Characteristic | Beta | SE1 | p-value |
|---|---|---|---|
| Intercept | 37 | 2.13 | <0.001 |
| Study Hours | 7.3 | 0.223 | <0.001 |
| No. Obs. = 65; Sigma = 7.91; R² = 0.944 | |||
| 1 SE = Standard Error | |||
The mean study hours is 8.46, with a standard deviation of 4.43.
- What is the predicted exam score if study hours is 4.76?
- What is the value of the test statistic for testing \(H_0: \beta_1 = 6.95\)?
- Give an \(83\%\) confidence interval for \(\beta_0\).
Lower Bound: Upper Bound:
- Give an \(83\%\) confidence interval for \(\beta_1\)
Lower Bound: Upper Bound:
- Give an \(83\%\) confidence interval for the expected exam score, if the study hours is 14.31.
Lower Bound: Upper Bound:
- Give an \(83\%\) prediction interval for the exam score, if the study hours is 14.31.
Lower Bound: Upper Bound:
(Question ID: 0052102316)
A doctor is studying the association between a patient’s age and their cholesterol level.
The results of the analysis are summarized in the following regression table.
| Characteristic | Beta | SE1 | p-value |
|---|---|---|---|
| Intercept | 144 | 4.62 | <0.001 |
| Age | 1.3 | 0.087 | <0.001 |
| No. Obs. = 89; Sigma = 13.8; R² = 0.723 | |||
| 1 SE = Standard Error | |||
The mean age is 50.26, with a standard deviation of 16.79.
- What is the predicted cholesterol level if age is 72.46?
- What is the value of the test statistic for testing \(H_0: \beta_1 = 1.06\)?
- Give an \(84\%\) confidence interval for \(\beta_0\).
Lower Bound: Upper Bound:
- Give an \(84\%\) confidence interval for \(\beta_1\)
Lower Bound: Upper Bound:
- Give an \(84\%\) confidence interval for the expected cholesterol level, if the age is 43.32.
Lower Bound: Upper Bound:
- Give an \(84\%\) prediction interval for the cholesterol level, if the age is 43.32.
Lower Bound: Upper Bound:
(Question ID: 0266972424)
A store owner wants to use linear regression to understand the relationship between a diamond’s cost and the number of carats it is.
The results of the analysis are summarized in the following regression table.
| Characteristic | Beta | SE1 | p-value |
|---|---|---|---|
| Intercept | -2,676 | 359 | <0.001 |
| Carat | 7,879 | 121 | <0.001 |
| No. Obs. = 87; Sigma = 1,547; R² = 0.980 | |||
| 1 SE = Standard Error | |||
The mean carat is 2.64, with a standard deviation of 1.38.
- What is the predicted cost if carat is 4.44?
- What is the value of the test statistic for testing \(H_0: \beta_1 = 7881.42\)?
- Give a \(98\%\) confidence interval for \(\beta_0\).
Lower Bound: Upper Bound:
- Give a \(98\%\) confidence interval for \(\beta_1\)
Lower Bound: Upper Bound:
- Give a \(98\%\) confidence interval for the expected cost, if the carat is 1.02.
Lower Bound: Upper Bound:
- Give a \(98\%\) prediction interval for the cost, if the carat is 1.02.
Lower Bound: Upper Bound:
(Question ID: 0355230141)
A student is investigating if there is a relationship between the number of siblings and their grade point average.
The results of the analysis are summarized in the following regression table.
| Characteristic | Beta | SE1 | p-value |
|---|---|---|---|
| Intercept | 3.0 | 0.096 | <0.001 |
| Number Of Siblings | 0.02 | 0.034 | 0.5 |
| No. Obs. = 93; Sigma = 0.440; R² = 0.005 | |||
| 1 SE = Standard Error | |||
The mean number of siblings is 2.48, with a standard deviation of 1.35.
- What is the predicted grade point average if number of siblings is 3.91?
- What is the value of the test statistic for testing \(H_0: \beta_1 = 0.01\)?
- Give an \(81\%\) confidence interval for \(\beta_0\).
Lower Bound: Upper Bound:
- Give an \(81\%\) confidence interval for \(\beta_1\)
Lower Bound: Upper Bound:
- Give an \(81\%\) confidence interval for the expected grade point average, if the number of siblings is 1.65.
Lower Bound: Upper Bound:
- Give an \(81\%\) prediction interval for the grade point average, if the number of siblings is 1.65.
Lower Bound: Upper Bound:
(Question ID: 0788502538)
A coffee shop owner wants to see if there’s a relationship between the temperature of a latte and customer satisfaction.
The results of the analysis are summarized in the following regression table.
| Characteristic | Beta | SE1 | p-value |
|---|---|---|---|
| Intercept | 6.7 | 4.74 | 0.2 |
| Latte Temperature | -0.01 | 0.030 | 0.7 |
| No. Obs. = 31; Sigma = 1.41; R² = 0.005 | |||
| 1 SE = Standard Error | |||
The mean latte temperature is 156.99, with a standard deviation of 8.52.
- What is the predicted customer satisfaction if latte temperature is 142.12?
- What is the value of the test statistic for testing \(H_0: \beta_1 = 0.08\)?
- Give an \(88\%\) confidence interval for \(\beta_0\).
Lower Bound: Upper Bound:
- Give an \(88\%\) confidence interval for \(\beta_1\)
Lower Bound: Upper Bound:
- Give an \(88\%\) confidence interval for the expected customer satisfaction, if the latte temperature is 146.98.
Lower Bound: Upper Bound:
- Give an \(88\%\) prediction interval for the customer satisfaction, if the latte temperature is 146.98.
Lower Bound: Upper Bound:
(Question ID: 0213331348)
A teacher is examining if the number of hours studied affects a student’s exam score.
The results of the analysis are summarized in the following regression table.
| Characteristic | Beta | SE1 | p-value |
|---|---|---|---|
| Intercept | 39 | 1.69 | <0.001 |
| Study Hours | 7.1 | 0.193 | <0.001 |
| No. Obs. = 98; Sigma = 7.80; R² = 0.934 | |||
| 1 SE = Standard Error | |||
The mean study hours is 7.74, with a standard deviation of 4.1.
- What is the predicted exam score if study hours is 7.11?
- What is the value of the test statistic for testing \(H_0: \beta_1 = 7.41\)?
- Give a \(94\%\) confidence interval for \(\beta_0\).
Lower Bound: Upper Bound:
- Give a \(94\%\) confidence interval for \(\beta_1\)
Lower Bound: Upper Bound:
- Give a \(94\%\) confidence interval for the expected exam score, if the study hours is 6.82.
Lower Bound: Upper Bound:
- Give a \(94\%\) prediction interval for the exam score, if the study hours is 6.82.
Lower Bound: Upper Bound:
(Question ID: 0293249357)
A meteorologist is examining the relationship between air pressure and the probability of rain.
The results of the analysis are summarized in the following regression table.
| Characteristic | Beta | SE1 | p-value |
|---|---|---|---|
| Intercept | -1.3 | 1.24 | 0.3 |
| Air Pressure | 0.00 | 0.001 | 0.2 |
| No. Obs. = 41; Sigma = 0.102; R² = 0.039 | |||
| 1 SE = Standard Error | |||
The mean air pressure is 999.42, with a standard deviation of 12.97.
- What is the predicted probability of rain if air pressure is 1025.95?
- What is the value of the test statistic for testing \(H_0: \beta_1 = 0\)?
- Give an \(84\%\) confidence interval for \(\beta_0\).
Lower Bound: Upper Bound:
- Give an \(84\%\) confidence interval for \(\beta_1\)
Lower Bound: Upper Bound:
- Give an \(84\%\) confidence interval for the expected probability of rain, if the air pressure is 995.29.
Lower Bound: Upper Bound:
- Give an \(84\%\) prediction interval for the probability of rain, if the air pressure is 995.29.
Lower Bound: Upper Bound:
(Question ID: 0317056779)
A teacher is examining if the number of hours studied affects a student’s exam score.
The results of the analysis are summarized in the following regression table.
| Characteristic | Beta | SE1 | p-value |
|---|---|---|---|
| Intercept | 39 | 1.88 | <0.001 |
| Study Hours | 7.0 | 0.211 | <0.001 |
| No. Obs. = 80; Sigma = 8.14; R² = 0.934 | |||
| 1 SE = Standard Error | |||
The mean study hours is 7.76, with a standard deviation of 4.33.
- What is the predicted exam score if study hours is 8.21?
- What is the value of the test statistic for testing \(H_0: \beta_1 = 6.66\)?
- Give a \(90\%\) confidence interval for \(\beta_0\).
Lower Bound: Upper Bound:
- Give a \(90\%\) confidence interval for \(\beta_1\)
Lower Bound: Upper Bound:
- Give a \(90\%\) confidence interval for the expected exam score, if the study hours is 2.05.
Lower Bound: Upper Bound:
- Give a \(90\%\) prediction interval for the exam score, if the study hours is 2.05.
Lower Bound: Upper Bound:
(Question ID: 0592564225)
A musician is exploring if there is a relationship between the number of practice hours and performance quality.
The results of the analysis are summarized in the following regression table.
| Characteristic | Beta | SE1 | p-value |
|---|---|---|---|
| Intercept | 2.4 | 0.483 | <0.001 |
| Practice Hours | 0.85 | 0.041 | <0.001 |
| No. Obs. = 44; Sigma = 1.58; R² = 0.911 | |||
| 1 SE = Standard Error | |||
The mean practice hours is 10.27, with a standard deviation of 5.89.
- What is the predicted performance quality if practice hours is 18.86?
- What is the value of the test statistic for testing \(H_0: \beta_1 = 0.88\)?
- Give a \(93\%\) confidence interval for \(\beta_0\).
Lower Bound: Upper Bound:
- Give a \(93\%\) confidence interval for \(\beta_1\)
Lower Bound: Upper Bound:
- Give a \(93\%\) confidence interval for the expected performance quality, if the practice hours is 17.72.
Lower Bound: Upper Bound:
- Give a \(93\%\) prediction interval for the performance quality, if the practice hours is 17.72.
Lower Bound: Upper Bound:
(Question ID: 0037236147)
A social scientist is studying the relationship between the number of social media followers and perceived popularity.
The results of the analysis are summarized in the following regression table.
| Characteristic | Beta | SE1 | p-value |
|---|---|---|---|
| Intercept | 1.9 | 0.173 | <0.001 |
| Number Of Followers | 0.00 | 0.000 | <0.001 |
| No. Obs. = 89; Sigma = 0.827; R² = 0.154 | |||
| 1 SE = Standard Error | |||
The mean number of followers is 5.058985^{4}, with a standard deviation of 2.99512^{4}.
- What is the predicted perceived popularity if number of followers is 3.186134^{4}?
- What is the value of the test statistic for testing \(H_0: \beta_1 = 0\)?
- Give a \(91\%\) confidence interval for \(\beta_0\).
Lower Bound: Upper Bound:
- Give a \(91\%\) confidence interval for \(\beta_1\)
Lower Bound: Upper Bound:
- Give a \(91\%\) confidence interval for the expected perceived popularity, if the number of followers is 8.39707^{4}.
Lower Bound: Upper Bound:
- Give a \(91\%\) prediction interval for the perceived popularity, if the number of followers is 8.39707^{4}.
Lower Bound: Upper Bound:
(Question ID: 0044574063)
A marketing team is exploring the relationship between the amount spent on advertising and product sales.
The results of the analysis are summarized in the following regression table.
| Characteristic | Beta | SE1 | p-value |
|---|---|---|---|
| Intercept | 103 | 7.69 | <0.001 |
| Advertising Spend | 2.5 | 0.025 | <0.001 |
| No. Obs. = 46; Sigma = 22.3; R² = 0.996 | |||
| 1 SE = Standard Error | |||
The mean advertising spend is 277.83, with a standard deviation of 133.09.
- What is the predicted product sales if advertising spend is 157?
- What is the value of the test statistic for testing \(H_0: \beta_1 = 2.52\)?
- Give an \(89\%\) confidence interval for \(\beta_0\).
Lower Bound: Upper Bound:
- Give an \(89\%\) confidence interval for \(\beta_1\)
Lower Bound: Upper Bound:
- Give an \(89\%\) confidence interval for the expected product sales, if the advertising spend is 371.61.
Lower Bound: Upper Bound:
- Give an \(89\%\) prediction interval for the product sales, if the advertising spend is 371.61.
Lower Bound: Upper Bound:
(Question ID: 0633110081)
A biologist is investigating the relationship between the height of a tree and its age.
The results of the analysis are summarized in the following regression table.
| Characteristic | Beta | SE1 | p-value |
|---|---|---|---|
| Intercept | 2.0 | 0.355 | <0.001 |
| Age | 0.50 | 0.005 | <0.001 |
| No. Obs. = 37; Sigma = 0.921; R² = 0.996 | |||
| 1 SE = Standard Error | |||
The mean age is 59.14, with a standard deviation of 28.32.
- What is the predicted height if age is 39.06?
- What is the value of the test statistic for testing \(H_0: \beta_1 = 0.51\)?
- Give an \(87\%\) confidence interval for \(\beta_0\).
Lower Bound: Upper Bound:
- Give an \(87\%\) confidence interval for \(\beta_1\)
Lower Bound: Upper Bound:
- Give an \(87\%\) confidence interval for the expected height, if the age is 47.5.
Lower Bound: Upper Bound:
- Give an \(87\%\) prediction interval for the height, if the age is 47.5.
Lower Bound: Upper Bound:
(Question ID: 0529489652)
A software engineer is analyzing if the number of lines of code affects the number of bugs.
The results of the analysis are summarized in the following regression table.
| Characteristic | Beta | SE1 | p-value |
|---|---|---|---|
| Intercept | 1.2 | 0.944 | 0.2 |
| Lines Of Code | 0.01 | 0.000 | <0.001 |
| No. Obs. = 44; Sigma = 3.02; R² = 0.955 | |||
| 1 SE = Standard Error | |||
The mean lines of code is 2441.29, with a standard deviation of 1360.23.
- What is the predicted number of bugs if lines of code is 2623.35?
- What is the value of the test statistic for testing \(H_0: \beta_1 = 0.01\)?
- Give a \(91\%\) confidence interval for \(\beta_0\).
Lower Bound: Upper Bound:
- Give a \(91\%\) confidence interval for \(\beta_1\)
Lower Bound: Upper Bound:
- Give a \(91\%\) confidence interval for the expected number of bugs, if the lines of code is 977.63.
Lower Bound: Upper Bound:
- Give a \(91\%\) prediction interval for the number of bugs, if the lines of code is 977.63.
Lower Bound: Upper Bound:
(Question ID: 0302077500)
A researcher is studying if there is a link between the amount of fertilizer used and the yield of corn.
The results of the analysis are summarized in the following regression table.
| Characteristic | Beta | SE1 | p-value |
|---|---|---|---|
| Intercept | 50 | 0.946 | <0.001 |
| Fertilizer Amount | 0.80 | 0.008 | <0.001 |
| No. Obs. = 100; Sigma = 4.34; R² = 0.990 | |||
| 1 SE = Standard Error | |||
The mean fertilizer amount is 105.65, with a standard deviation of 54.89.
- What is the predicted corn yield if fertilizer amount is 95.35?
- What is the value of the test statistic for testing \(H_0: \beta_1 = 0.83\)?
- Give a \(93\%\) confidence interval for \(\beta_0\).
Lower Bound: Upper Bound:
- Give a \(93\%\) confidence interval for \(\beta_1\)
Lower Bound: Upper Bound:
- Give a \(93\%\) confidence interval for the expected corn yield, if the fertilizer amount is 126.56.
Lower Bound: Upper Bound:
- Give a \(93\%\) prediction interval for the corn yield, if the fertilizer amount is 126.56.
Lower Bound: Upper Bound:
(Question ID: 0337677420)
A student is investigating if there is a relationship between the number of siblings and their grade point average.
The results of the analysis are summarized in the following regression table.
| Characteristic | Beta | SE1 | p-value |
|---|---|---|---|
| Intercept | 2.8 | 0.178 | <0.001 |
| Number Of Siblings | 0.06 | 0.060 | 0.4 |
| No. Obs. = 38; Sigma = 0.459; R² = 0.024 | |||
| 1 SE = Standard Error | |||
The mean number of siblings is 2.7, with a standard deviation of 1.26.
- What is the predicted grade point average if number of siblings is 3.67?
- What is the value of the test statistic for testing \(H_0: \beta_1 = 0.17\)?
- Give a \(96\%\) confidence interval for \(\beta_0\).
Lower Bound: Upper Bound:
- Give a \(96\%\) confidence interval for \(\beta_1\)
Lower Bound: Upper Bound:
- Give a \(96\%\) confidence interval for the expected grade point average, if the number of siblings is 3.73.
Lower Bound: Upper Bound:
- Give a \(96\%\) prediction interval for the grade point average, if the number of siblings is 3.73.
Lower Bound: Upper Bound:
(Question ID: 0145189442)
A city planner is examining the relationship between the distance from the city center and housing price.
The results of the analysis are summarized in the following regression table.
| Characteristic | Beta | SE1 | p-value |
|---|---|---|---|
| Intercept | 493,091 | 11,990 | <0.001 |
| Distance From City Center | -4,154 | 1,023 | <0.001 |
| No. Obs. = 32; Sigma = 30,482; R² = 0.355 | |||
| 1 SE = Standard Error | |||
The mean distance from city center is 10.47, with a standard deviation of 5.35.
- What is the predicted housing price if distance from city center is 12.3?
- What is the value of the test statistic for testing \(H_0: \beta_1 = -3427.67\)?
- Give an \(88\%\) confidence interval for \(\beta_0\).
Lower Bound: Upper Bound:
- Give an \(88\%\) confidence interval for \(\beta_1\)
Lower Bound: Upper Bound:
- Give an \(88\%\) confidence interval for the expected housing price, if the distance from city center is 18.04.
Lower Bound: Upper Bound:
- Give an \(88\%\) prediction interval for the housing price, if the distance from city center is 18.04.
Lower Bound: Upper Bound:
(Question ID: 0620738819)
A scientist is investigating if there is a relationship between the temperature of a reaction and its rate.
The results of the analysis are summarized in the following regression table.
| Characteristic | Beta | SE1 | p-value |
|---|---|---|---|
| Intercept | 0.17 | 0.031 | <0.001 |
| Temperature | 0.02 | 0.001 | <0.001 |
| No. Obs. = 33; Sigma = 0.051; R² = 0.975 | |||
| 1 SE = Standard Error | |||
The mean temperature is 54.13, with a standard deviation of 16.46.
- What is the predicted reaction rate if temperature is 50.45?
- What is the value of the test statistic for testing \(H_0: \beta_1 = 0.02\)?
- Give a \(93\%\) confidence interval for \(\beta_0\).
Lower Bound: Upper Bound:
- Give a \(93\%\) confidence interval for \(\beta_1\)
Lower Bound: Upper Bound:
- Give a \(93\%\) confidence interval for the expected reaction rate, if the temperature is 40.06.
Lower Bound: Upper Bound:
- Give a \(93\%\) prediction interval for the reaction rate, if the temperature is 40.06.
Lower Bound: Upper Bound:
(Question ID: 0269674982)
A marketing team is exploring the relationship between the amount spent on advertising and product sales.
The results of the analysis are summarized in the following regression table.
| Characteristic | Beta | SE1 | p-value |
|---|---|---|---|
| Intercept | 94 | 5.27 | <0.001 |
| Advertising Spend | 2.5 | 0.018 | <0.001 |
| No. Obs. = 69; Sigma = 17.9; R² = 0.997 | |||
| 1 SE = Standard Error | |||
The mean advertising spend is 272.59, with a standard deviation of 122.72.
- What is the predicted product sales if advertising spend is 483.23?
- What is the value of the test statistic for testing \(H_0: \beta_1 = 2.54\)?
- Give an \(85\%\) confidence interval for \(\beta_0\).
Lower Bound: Upper Bound:
- Give an \(85\%\) confidence interval for \(\beta_1\)
Lower Bound: Upper Bound:
- Give an \(85\%\) confidence interval for the expected product sales, if the advertising spend is 119.86.
Lower Bound: Upper Bound:
- Give an \(85\%\) prediction interval for the product sales, if the advertising spend is 119.86.
Lower Bound: Upper Bound:
(Question ID: 0447264872)
A researcher is studying if there is a link between the amount of fertilizer used and the yield of corn.
The results of the analysis are summarized in the following regression table.
| Characteristic | Beta | SE1 | p-value |
|---|---|---|---|
| Intercept | 50 | 1.65 | <0.001 |
| Fertilizer Amount | 0.81 | 0.014 | <0.001 |
| No. Obs. = 59; Sigma = 5.75; R² = 0.984 | |||
| 1 SE = Standard Error | |||
The mean fertilizer amount is 106.82, with a standard deviation of 54.91.
- What is the predicted corn yield if fertilizer amount is 165.31?
- What is the value of the test statistic for testing \(H_0: \beta_1 = 0.78\)?
- Give an \(86\%\) confidence interval for \(\beta_0\).
Lower Bound: Upper Bound:
- Give an \(86\%\) confidence interval for \(\beta_1\)
Lower Bound: Upper Bound:
- Give an \(86\%\) confidence interval for the expected corn yield, if the fertilizer amount is 117.02.
Lower Bound: Upper Bound:
- Give an \(86\%\) prediction interval for the corn yield, if the fertilizer amount is 117.02.
Lower Bound: Upper Bound:
(Question ID: 0801009858)
A farmer is looking at the relationship between rainfall and crop yield.
The results of the analysis are summarized in the following regression table.
| Characteristic | Beta | SE1 | p-value |
|---|---|---|---|
| Intercept | 27 | 2.29 | <0.001 |
| Rainfall | 0.64 | 0.035 | <0.001 |
| No. Obs. = 85; Sigma = 7.35; R² = 0.806 | |||
| 1 SE = Standard Error | |||
The mean rainfall is 62.18, with a standard deviation of 23.2.
- What is the predicted crop yield if rainfall is 21.37?
- What is the value of the test statistic for testing \(H_0: \beta_1 = 0.57\)?
- Give a \(97\%\) confidence interval for \(\beta_0\).
Lower Bound: Upper Bound:
- Give a \(97\%\) confidence interval for \(\beta_1\)
Lower Bound: Upper Bound:
- Give a \(97\%\) confidence interval for the expected crop yield, if the rainfall is 81.
Lower Bound: Upper Bound:
- Give a \(97\%\) prediction interval for the crop yield, if the rainfall is 81.
Lower Bound: Upper Bound:
(Question ID: 0603577697)
A scientist is investigating if there is a relationship between the temperature of a reaction and its rate.
The results of the analysis are summarized in the following regression table.
| Characteristic | Beta | SE1 | p-value |
|---|---|---|---|
| Intercept | 0.11 | 0.021 | <0.001 |
| Temperature | 0.02 | 0.000 | <0.001 |
| No. Obs. = 62; Sigma = 0.052; R² = 0.975 | |||
| 1 SE = Standard Error | |||
The mean temperature is 49.09, with a standard deviation of 16.22.
- What is the predicted reaction rate if temperature is 60.07?
- What is the value of the test statistic for testing \(H_0: \beta_1 = 0.02\)?
- Give a \(94\%\) confidence interval for \(\beta_0\).
Lower Bound: Upper Bound:
- Give a \(94\%\) confidence interval for \(\beta_1\)
Lower Bound: Upper Bound:
- Give a \(94\%\) confidence interval for the expected reaction rate, if the temperature is 60.14.
Lower Bound: Upper Bound:
- Give a \(94\%\) prediction interval for the reaction rate, if the temperature is 60.14.
Lower Bound: Upper Bound:
(Question ID: 0804976744)
A marketing team is exploring the relationship between the amount spent on advertising and product sales.
The results of the analysis are summarized in the following regression table.
| Characteristic | Beta | SE1 | p-value |
|---|---|---|---|
| Intercept | 93 | 6.36 | <0.001 |
| Advertising Spend | 2.5 | 0.021 | <0.001 |
| No. Obs. = 39; Sigma = 18.5; R² = 0.997 | |||
| 1 SE = Standard Error | |||
The mean advertising spend is 263.56, with a standard deviation of 140.56.
- What is the predicted product sales if advertising spend is 193.37?
- What is the value of the test statistic for testing \(H_0: \beta_1 = 2.43\)?
- Give a \(97\%\) confidence interval for \(\beta_0\).
Lower Bound: Upper Bound:
- Give a \(97\%\) confidence interval for \(\beta_1\)
Lower Bound: Upper Bound:
- Give a \(97\%\) confidence interval for the expected product sales, if the advertising spend is 337.14.
Lower Bound: Upper Bound:
- Give a \(97\%\) prediction interval for the product sales, if the advertising spend is 337.14.
Lower Bound: Upper Bound:
(Question ID: 0262590900)
A store owner wants to use linear regression to understand the relationship between a diamond’s cost and the number of carats it is.
The results of the analysis are summarized in the following regression table.
| Characteristic | Beta | SE1 | p-value |
|---|---|---|---|
| Intercept | -1,939 | 633 | 0.005 |
| Carat | 7,717 | 211 | <0.001 |
| No. Obs. = 32; Sigma = 1,845; R² = 0.978 | |||
| 1 SE = Standard Error | |||
The mean carat is 2.57, with a standard deviation of 1.57.
- What is the predicted cost if carat is 1.13?
- What is the value of the test statistic for testing \(H_0: \beta_1 = 7930.11\)?
- Give an \(86\%\) confidence interval for \(\beta_0\).
Lower Bound: Upper Bound:
- Give an \(86\%\) confidence interval for \(\beta_1\)
Lower Bound: Upper Bound:
- Give an \(86\%\) confidence interval for the expected cost, if the carat is 0.57.
Lower Bound: Upper Bound:
- Give an \(86\%\) prediction interval for the cost, if the carat is 0.57.
Lower Bound: Upper Bound:
(Question ID: 0904403416)
A biologist is investigating the relationship between the height of a tree and its age.
The results of the analysis are summarized in the following regression table.
| Characteristic | Beta | SE1 | p-value |
|---|---|---|---|
| Intercept | 1.6 | 0.268 | <0.001 |
| Age | 0.50 | 0.005 | <0.001 |
| No. Obs. = 57; Sigma = 0.847; R² = 0.995 | |||
| 1 SE = Standard Error | |||
The mean age is 52.56, with a standard deviation of 24.48.
- What is the predicted height if age is 93.74?
- What is the value of the test statistic for testing \(H_0: \beta_1 = 0.5\)?
- Give a \(90\%\) confidence interval for \(\beta_0\).
Lower Bound: Upper Bound:
- Give a \(90\%\) confidence interval for \(\beta_1\)
Lower Bound: Upper Bound:
- Give a \(90\%\) confidence interval for the expected height, if the age is 29.44.
Lower Bound: Upper Bound:
- Give a \(90\%\) prediction interval for the height, if the age is 29.44.
Lower Bound: Upper Bound:
(Question ID: 0471112685)
A meteorologist is examining the relationship between air pressure and the probability of rain.
The results of the analysis are summarized in the following regression table.
| Characteristic | Beta | SE1 | p-value |
|---|---|---|---|
| Intercept | 0.81 | 0.697 | 0.2 |
| Air Pressure | 0.00 | 0.001 | 0.4 |
| No. Obs. = 97; Sigma = 0.096; R² = 0.006 | |||
| 1 SE = Standard Error | |||
The mean air pressure is 1005.1, with a standard deviation of 14.13.
- What is the predicted probability of rain if air pressure is 980.37?
- What is the value of the test statistic for testing \(H_0: \beta_1 = 0\)?
- Give an \(87\%\) confidence interval for \(\beta_0\).
Lower Bound: Upper Bound:
- Give an \(87\%\) confidence interval for \(\beta_1\)
Lower Bound: Upper Bound:
- Give an \(87\%\) confidence interval for the expected probability of rain, if the air pressure is 1019.32.
Lower Bound: Upper Bound:
- Give an \(87\%\) prediction interval for the probability of rain, if the air pressure is 1019.32.
Lower Bound: Upper Bound:
(Question ID: 0262136327)
A car manufacturer is looking at the relationship between engine size and fuel efficiency.
The results of the analysis are summarized in the following regression table.
| Characteristic | Beta | SE1 | p-value |
|---|---|---|---|
| Intercept | 40 | 1.09 | <0.001 |
| Engine Size | -5.0 | 0.403 | <0.001 |
| No. Obs. = 79; Sigma = 2.96; R² = 0.666 | |||
| 1 SE = Standard Error | |||
The mean engine size is 2.57, with a standard deviation of 0.83.
- What is the predicted fuel efficiency if engine size is 2.13?
- What is the value of the test statistic for testing \(H_0: \beta_1 = -5.58\)?
- Give an \(85\%\) confidence interval for \(\beta_0\).
Lower Bound: Upper Bound:
- Give an \(85\%\) confidence interval for \(\beta_1\)
Lower Bound: Upper Bound:
- Give an \(85\%\) confidence interval for the expected fuel efficiency, if the engine size is 3.07.
Lower Bound: Upper Bound:
- Give an \(85\%\) prediction interval for the fuel efficiency, if the engine size is 3.07.
Lower Bound: Upper Bound:
(Question ID: 0914462963)
A biologist is investigating the relationship between the height of a tree and its age.
The results of the analysis are summarized in the following regression table.
| Characteristic | Beta | SE1 | p-value |
|---|---|---|---|
| Intercept | 1.8 | 0.275 | <0.001 |
| Age | 0.51 | 0.004 | <0.001 |
| No. Obs. = 65; Sigma = 0.907; R² = 0.995 | |||
| 1 SE = Standard Error | |||
The mean age is 58.11, with a standard deviation of 26.24.
- What is the predicted height if age is 49.79?
- What is the value of the test statistic for testing \(H_0: \beta_1 = 0.51\)?
- Give a \(93\%\) confidence interval for \(\beta_0\).
Lower Bound: Upper Bound:
- Give a \(93\%\) confidence interval for \(\beta_1\)
Lower Bound: Upper Bound:
- Give a \(93\%\) confidence interval for the expected height, if the age is 63.34.
Lower Bound: Upper Bound:
- Give a \(93\%\) prediction interval for the height, if the age is 63.34.
Lower Bound: Upper Bound:
(Question ID: 0942034965)
A marketing team is exploring the relationship between the amount spent on advertising and product sales.
The results of the analysis are summarized in the following regression table.
| Characteristic | Beta | SE1 | p-value |
|---|---|---|---|
| Intercept | 97 | 6.89 | <0.001 |
| Advertising Spend | 2.5 | 0.022 | <0.001 |
| No. Obs. = 48; Sigma = 19.8; R² = 0.996 | |||
| 1 SE = Standard Error | |||
The mean advertising spend is 281.91, with a standard deviation of 129.51.
- What is the predicted product sales if advertising spend is 315.06?
- What is the value of the test statistic for testing \(H_0: \beta_1 = 2.51\)?
- Give an \(88\%\) confidence interval for \(\beta_0\).
Lower Bound: Upper Bound:
- Give an \(88\%\) confidence interval for \(\beta_1\)
Lower Bound: Upper Bound:
- Give an \(88\%\) confidence interval for the expected product sales, if the advertising spend is 232.9.
Lower Bound: Upper Bound:
- Give an \(88\%\) prediction interval for the product sales, if the advertising spend is 232.9.
Lower Bound: Upper Bound:
(Question ID: 0927113199)
A doctor is studying the association between a patient’s age and their cholesterol level.
The results of the analysis are summarized in the following regression table.
| Characteristic | Beta | SE1 | p-value |
|---|---|---|---|
| Intercept | 146 | 5.45 | <0.001 |
| Age | 1.3 | 0.100 | <0.001 |
| No. Obs. = 49; Sigma = 12.4; R² = 0.777 | |||
| 1 SE = Standard Error | |||
The mean age is 51.52, with a standard deviation of 17.84.
- What is the predicted cholesterol level if age is 45.3?
- What is the value of the test statistic for testing \(H_0: \beta_1 = 1.69\)?
- Give an \(88\%\) confidence interval for \(\beta_0\).
Lower Bound: Upper Bound:
- Give an \(88\%\) confidence interval for \(\beta_1\)
Lower Bound: Upper Bound:
- Give an \(88\%\) confidence interval for the expected cholesterol level, if the age is 59.08.
Lower Bound: Upper Bound:
- Give an \(88\%\) prediction interval for the cholesterol level, if the age is 59.08.
Lower Bound: Upper Bound:
(Question ID: 0975407789)
Remember, the slope is the “rise” over the “run”.↩︎
Technically, the \(y\)-intercept, though, we predominantly discuss only the \(y\)-intercept.↩︎
Note, in the case of \(y = x^2\), we would need this to be for only positive (or only negative) \(x\). The problem with the transformation \(\sqrt{y}\) is that it is not one-to-one. For every value of \(y\), there are two values of \(\sqrt{y}\) (namely, the positive and negative roots). If our data existed over \(x\) values that were both positive and negative, we would end-up considering a graph that resembles \(y \approx |x|\) rather than \(y \approx x\). This is technically two separate linear relationships, stuck together.↩︎
There are regression-type methods for non-continuous outcomes. These require more advanced techniques, but the same underlying ideas will hold.↩︎
Note, there are more advanced regression techniques that allow for the relaxation of the homoscedasticity assumption.↩︎
Note, it is conceptually possible to define other “best” lines. You could have thought to take \(|y_i - \widehat{y}_i|\) or similar instead. Doing this results in alternative forms of the regression relationship, forms that exhibit slightly different properties. The least squares regression tends to be the most common in use, is the most well-studied, and is in many ways the most mathematically convenient.↩︎
As well as, more critically, the assumption that the regression model is correct and the assumption that variances are homoscedastic.↩︎
Recall that the standard errors are given by the square root of the variance terms. It is convenient when the variance of the estimator is a fairly involved expression (as is the case for the regression parameters), to use the shorthand notation.↩︎
Linear relationship.↩︎
This case is of course far more common in practice↩︎
Note, a more thorough, theoretical account of these issues is available here. This requires a deeper understanding of regression more broadly.↩︎
Namely, the conditional distribution of \(Y\) given \(X=x\).↩︎
This distinction is analogous to the estimates and estimators distinction.↩︎
With a normal distribution.↩︎
With a \(t\) distribution↩︎
Using ordinary least squares.↩︎
Perhaps a \(1\) if an individual has a particular disease, and a \(0\) otherwise.↩︎
Maybe the number of defective products produced in a shift by a manufacturing plant.↩︎